


Principles of Capital Allocation
Capital Allocation Principles Although the known analytical tools and investment decision criteria are... Read More

Several important decision-making criteria are used to evaluate capital investments. The two most comprehensive and well-understood measures of whether or not a project is profitable are the net present value (NPV) and the internal rate of return (IRR). Other measures include the payback period, discounted payback period, average accounting rate of return (AAR), and the profitability index (PI).
The net present value (NPV) of a project is the potential change attributed to a project after accounting for the time value of money. The NPV for a project with one investment outlay made at its initiation is defined as the present value of the future after-tax cash flows minus the investment outlay.
$$ \mathrm{NPV}=\sum_{t=1}^{n} \frac{C F_{t}}{(1+r)^{t}} \text { – Outlay } $$
Where:
\(CF_t\) = After-tax cash flow at time \(t\).
\(r\) = Required rate of return for the investment.
\(\text{Outlay}\) = Investment cash flow at time zero.
Many projects have cash flow patterns in which outflows not only occur at the time of initiation (at time = 0) but also at future dates. In these instances, a better formula to use is:
In other words, positive NPV investments are wealth increasing, while negative NPV investments are wealth decreasing.
Assume that Company A is considering an investment of $100 million in a capital expansion project that will return after-tax cash flows of $20 million per year for the first 3 years and another $33 million in year 4, the final year of the project. If the required rate of return for the project is 8%, what would the NPV be, and should the company undertake this project?
$$
\begin{aligned}
\mathrm{NPV} &=\frac{20}{1.08^{1}}+\frac{20}{1.08^{2}}+\frac{20}{1.08^{3}}+\frac{33}{1.08^{4}}-100 \\
&=18.519+17.147+15.877+24.256-100 \\
&=-\$ 24.201 \text { million }
\end{aligned}
$$
Since the NPV < 0, the project should not be undertaken.
The internal rate of return (IRR) is the discount rate that makes the net present value (NPV) of all cash flows from a particular project equal to zero. For a project with one initial outlay, the IRR is the discount rate that makes the present value of the future after-tax cash flows equal to the investment outlay.
The IRR solves the equation:
$$ \sum_{t=1}^{n} \frac{C F_{t}}{(1+I R R)^{t}}-\text { Outlay }=0 $$
It looks very much like the NPV equation, except that the discount rate is the IRR instead of \(r\), the required rate of return. Discounted at the IRR, the NPV is equal to zero.
The decision rule for the IRR is:
In instances where the outlays for a project occur at times other than time 0, a more general form of the IRR equation is:
$$ \sum_{t=0}^{n} \frac{C F_{t}}{(1+I R R)^{t}}=0 $$
Here is a follow-up on the above NPV example. Assume that Company A is considering an investment of $100 million in a capital expansion project that will return after-tax cash flows of $20 million per year for the first 3 years and another $33 million in year 4, the final year of the project. What is the IRR for this project, and should it be undertaken given that the required rate of return for the project is 8%?
Solve IRR in the following equation:
$$ -100+\frac{20}{(1+I R R)^{1}}+\frac{20}{(1+I R R)^{2}}+\frac{20}{(1+I R R)^{3}}+\frac{33}{(1+I R R)^{4}}=0 $$
The solution can be arrived at through trial and error. However, a simpler approach is to use a financial calculator:
Press the Cash Flow [CF] key to open the cash flow register. The calculator should read CF0=, which tells you to enter the cash flow for time 0. Since you need to send cash out of the company to make the initial $100 investment, this value has to be negative. Key in -100 for CF0, and hit the [ENTER] key.
Next, enter the cash flow values for the subsequent periods. This is done by hitting the down arrow once. The calculator should read CF1=. Type in the amount for the first cash flow, 20, and hit [ENTER]. The calculator should now say C01=20.
To enter cash flow from Year 2, hit the down arrow twice. The calculator should read CF2=. If it says F1=, hit the down arrow one more time.
Type in the second year’s cash flow, 20, and hit [Enter]. The calculator should read CF2=20. Hit the down arrow twice, again, and do the same for the third cash flow period, CF3.
Do this once more and for the last time to enter the last cash flow, 33.
Once the cash flow values have been fed into the calculator, you are ready to calculate the IRR.
To do this, press the [IRR] key. The screen will read IRR=0.000. To display the IRR value for the data set, press the [CPT] key at the top left corner of the calculator. If you have followed this process correctly, the calculator will display the correct IRR. The IRR is computed to be -2.626%. Since -2.626% < 8%, the project should not be undertaken.
Simply computing a project’s NPV and IRR to determine which of several projects to undertake is not always as straightforward. The IRR and NPV can produce different ranking outcomes whenever mutually exclusive projects are involved. Nevertheless, other challenges may occur.
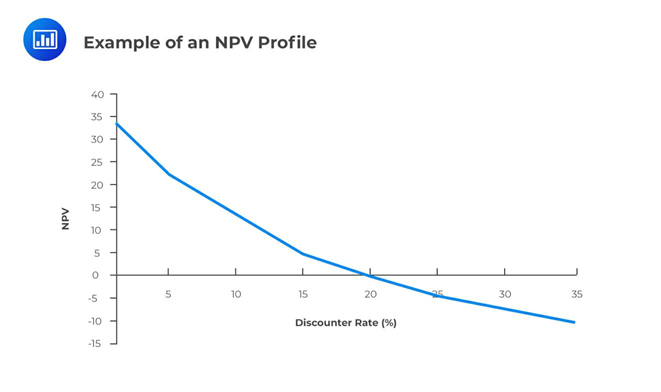
The NPV Profile illustrates a project’s NPV graphed as a function of various discount rates. The NPV values are graphed on the vertical or y-axis, while the discount rates are graphed on the horizontal or x-axis.
For independent, conventional projects, the decision rules for the NPV and IRR will both draw the same conclusion on whether to invest or not. However, in the case of two mutually exclusive projects, the decision rules will sometimes draw different conclusions. For example, project X might have a larger NPV than project Y, but project Y might have a larger IRR. This conflict usually stems from differences in the cash flows of the two projects, which leads to a different ranking between the NPV and IRR. Whenever this conflict arises, the NPV, not the IRR, should be used to select the project to invest in.
Another circumstance that may cause mutually exclusive projects to be ranked differently according to NPV and IRR criteria is the scale or size of the project.
Although rare, a project may have more than one IRR or no IRR at all. However, multiple IRRs cannot occur for conventional projects with cash outlay followed by cash inflows. Still, they may occur for non-conventional projects with cash flows that change signs (negative, positive) more than once during a project’s life.
The net present value (NPV) and the internal rate of return (IRR) are both techniques that financial institutions or individuals can use when they are making major investment decisions. Each method has its strengths and weaknesses. However, the net present value method comes out on top, and here’s why. Both NPV and IRR will yield the same investment decisions when dealing with independent projects. By independent, we mean that deciding to invest in one project does not rule out or affect investment in another project.
However, a challenge arises when projects are mutually exclusive. If two or more projects are mutually exclusive, the decision to invest in one project precludes investment in all the others. With such projects, the IRR method may provide misleading results if used in isolation.
As seen, there are some problems associated with the IRR method:
Question 1
You have been provided with the following cash flows for a capital project:
$$ \begin{array}{c|c|c|c|c|c|c}
\text { Year } & 0 & 1 & 2 & 3 & 4 & 5 \\
\hline \text { Cash flow }(\$) & -50,000 & 10,000 & 10,000 & 15,000 & 15,000 & 15,000
\end{array} $$Given a required rate of return of 8 percent, the NPV and IRR of the project are closest to:
- NPV: $1,023; IRR: 10.64%.
- NPV: $974; IRR: 8.68%.
- NPV: $2,400; IRR: 7.12%.
Solution
The correct answer is B.
$$ \begin{aligned}
\text{NPV}&=-50,000+\frac{10,000}{1.08^{1}}+\frac{10,000}{1.08^{2}}+\frac{15,000}{1.08^{3}}+\frac{15,000}{1.08^{4}}+\frac{15,000}{1.08^{5}} \\
&=-50,000+9259.26+8573.39+11,907.48++11,025.45+10,208.75 \\
&=\$ 974.33 \text { million }
\end{aligned} $$Question 2
In an NPV profile, the point at which the profile crosses the x-axis is best described as:
- The project’s IRR.
- The point at which the NPV is highest.
- The point at which the discount rate = 0% and the NPV is the sum of the undiscounted cash flows for the project.
Solution
The correct answer is A.
At the horizontal axis, the NPV = 0, and by definition, this occurs whenever the discount rate is the IRR.
Question 3
Suppose you have three independent projects – X, Y, and Z. Assume that the hurdle rate is 12% for all the three projects. Their NPVs and IRRs are as shown below.
$$ \begin{array}{c|c|c|c}
& \textbf { Project X } & \textbf { Project Y } & \textbf { Project Z } \\
\hline \text { NPV } & \$ 20,000 & \$ 21,400 & \$ 23,000 \\
\text { IRR } & 20 \% & 32 \% & 18 \%
\end{array} $$Assuming the projects are mutually exclusive, which of the following is the most economically feasible project?
- Z.
- X.
- Y.
Solution
The correct answer is A.
$$
\begin{array}{c|c|c|c}
& \textbf { Project } \mathbf{X} & \textbf { Project Y } & \textbf { Project } \mathbf{Z} \\
\hline \text { NPV } & \$ 20,000 & \$ 21,400 & \$ 23,000 \\
\text { IRR } & 20 \% & 32 \% & 18 \% \\
\text { Decision } & \text { Accept } & \text { Accept } & \text { Accept }
\end{array}
$$If the IRR criterion is used, all the three projects would be accepted because they would all increase shareholders’ wealth. Their NPVs are all positive and, again, the three are all acceptable.
However, if the projects are mutually exclusive, then, only one project would be chosen. If one were to pick one project based on internal rates of return of the projects, then one would go for Y. This is because its IRR is the highest compared to the other projects.
This decision would be wrong when we consider the sizes of the NPVs of the projects. While Y has the highest IRR, its NPV is lower than that of Z. The best decision would be to go for the project with the highest NPV, and that is project Z. Therefore, if projects are mutually exclusive, the NPV method should be applied.
Net present value and internal rate of return are important CFA Level I Corporate Issuers concepts. Candidates may be tested on project selection decisions, comparing investment opportunities, and interpreting capital budgeting results under different assumptions.
To strengthen your preparation, explore the CFA Level I study program with practice questions, mock exams, and guided lessons.
Strengthen your understanding of NPV, IRR, and capital budgeting decisions with structured CFA Level I practice and step-by-step explanations.


Get Ahead on Your Study Prep This Cyber Monday! Save 35% on all CFA® and FRM® Unlimited Packages. Use code CYBERMONDAY at checkout. Offer ends Dec 1st.