Describe “Fintech”
[vsw id=”ji2GmIdIvOY” source=”youtube” width=”611″ height=”344″ autoplay=”no”] Introduction Since computers whirred into life in... Read More
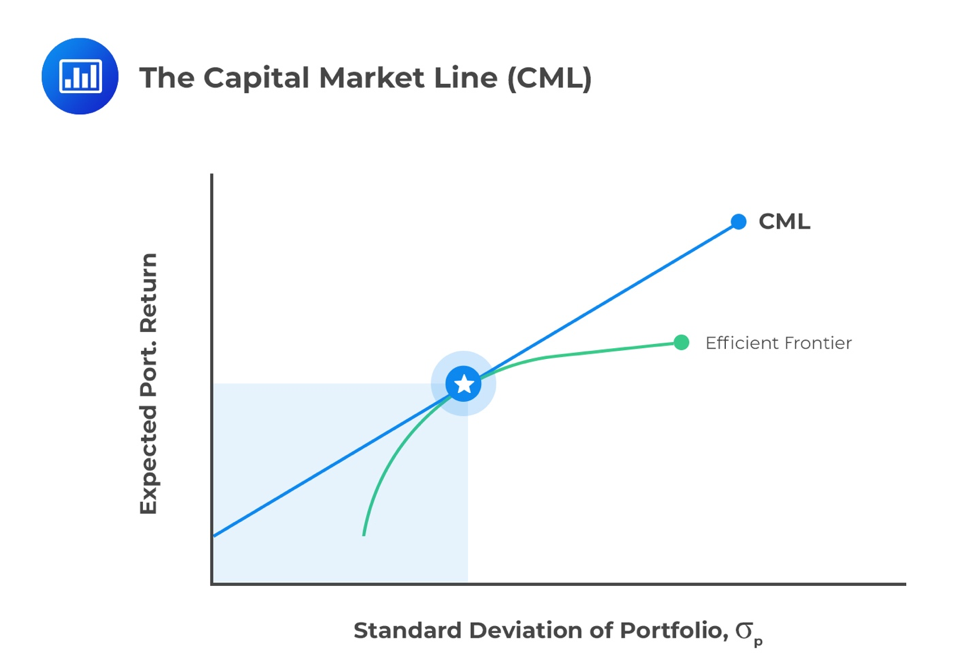
We form a capital allocation line when we combine a risky asset portfolio with a risk-free asset. This represents the allocation between risk-free and risky assets based on investor risk preferences. The capital market line is a special case of the CAL, where the portfolio of risky assets is the market portfolio.
A market can be informationally efficient. In such a case, the quoted security price in the market is an unbiased estimate of all the future discounted cash flows and reflects all publicly known information about the security. If all security prices reflect all publicly available information, then, in theory, there is no way to outperform the market. If this is the investor’s belief, then investing in a passive portfolio is the simplest and most convenient approach. A passive portfolio will track and replicate the market.
Many investors do not believe the market price accurately reflects valuations. They have confidence in their ability to determine these mispricings based on their evaluation models. Such investors take an active approach to investing and overweighting undervalued assets and underweighting (or shorting, if allowed) overvalued assets. This style of investing is called active management.
The market includes all risky assets or anything that has value – stocks, bonds, real estate, human capital, and commodities. These assets are all defined in “the market.” Not all market assets are tradable or investable. If global assets are considered, hundreds of thousands of individual securities make up the market and are considered tradable and investable. A typical investor is likely to rely on their local or regional stock market as a measure of “the market”.
The Capital Market Line (CML) is a special case of the CAL, that is, the line that makes up the allocation between a risk-free asset and a risky portfolio for an investor. In the case of the CML, the risk portfolio is the market portfolio. Where an investor has defined “the market” to be their domestic stock market index, the expected return of the market is expressed as the expected return of that index. The risk-return characteristics for the potential risk asset portfolios can be plotted to generate a Markowitz efficient frontier. The point at which the line from the risk-free asset touches or is tangential to the Markowitz portfolio is defined as the market portfolio. The line connecting the risk-free asset with the market portfolio is the CML.

The expected return and variance for the portfolio can be represented as follows:
$$ \text{Expected return} = E(R_P) = wR_f + (1-w)E(R_m) $$
$$ \text{Variance} = \sigma_P^2 = w^2\sigma_f^2 + (1-w)^2\sigma_m^2 + 2w(1-w)Cov(R_f,R_m) $$
Where:
\(R_f\) is the return on the risk-free asset.
\(R_m\) is the return on the market.
\(w\) is the weight of the risk-free asset in the portfolio.
\(1-w\) is the weight of the market asset in the portfolio.
Theoretically, the standard deviation of the risk-free asset is zero, and the term, \(w^2\sigma_f^2\) falls out of the equation. Equally, the risk-free asset is assumed to have no covariance with the market portfolio. This means that the portfolio standard deviation is written as:
$$ \sigma_p = (1 – w)\sigma_m $$
By substitution, we can write:
$$ E(R_p) = R_f + \frac {E(R_m) – R_f}{\sigma_m} × \sigma_p $$
This is in the form of an equation of a straight line where the intercept is Rf, and the slope is \(\frac {E(R_m) – R_f}{\sigma_m}\). This is the CML line which has a positive slope as the market return is greater than the risk-free return.
Question
What happens to the portfolio risk and return, respectively, as an investor moves up the CML?
A. Risk decreases, return decreases.
B. Risk increases, return decreases.
C. Risk increases, return increases.
Solution
The correct answer is C.
The overall portfolio risk and return increase as an investor moves up the CML.
Get Ahead on Your Study Prep This Cyber Monday! Save 35% on all CFA® and FRM® Unlimited Packages. Use code CYBERMONDAY at checkout. Offer ends Dec 1st.