


Detail & Purpose (GMAT Course segm ...
The most common reading comprehension questions you will find on the verbal section... Read More

During December 2017 sitting, the CFA® institute changed the way they would report CFA candidate results. The institution introduced the new format because it gave candidates a wealth of information on their overall performance. In addition, the new format allows instructors to respond to the feedback of candidates and enable fuller transparency into candidates’ exam results. The goal was to ensure that the score report helped candidates who failed be optimistic, look ahead and strategize effectively on their studies.
The unique design of interpreting CFA result involved comparing performance with the minimum passing score with other candidates and comparing performance by specific topic. Secondly, the CFA institute chose this format because they believed that the CFA result breakdown could significantly support students’ future studies when students use it appropriately.
The old CFA result format could not provide candidates with a broader picture of improving their studying habits to achieve a better outcome in their following exams. It had no reference to the minimum passing score, the most crucial data point from a candidate’s viewpoint. Secondly, the old CFA result format lacked topic difficulty was too broad and had a low correlation.
The new CFA result format aims to resolve the limitation of the old CFA format and provide candidates with greater transparency that encourages them to develop the best studying plan for their studies. Indeed, the CFA institute achieved this objective, and the early candidate feedback justified this claim for the CFA Institute.
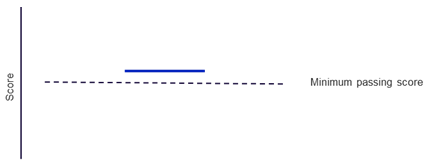
The first aspect of the new CFA result format was that it has a minimum passing score (MPS), which is the most critical information since it indicates how close their overall exam score was to the minimum passing score. It is the benchmark that determines whether the candidate has failed or passed.
The CFA institute sets the MPS through workshops where participants go through the entire exam multiple times, examining the questions to make an independent judgment on the expected performance of the just competent candidate for every question.
The judgments are then correlated and reviewed, and a report is released providing a score range for the exam. Then the Board of Governors of CFA institute utilizes the report as the foundation for setting the MPS for each level. Usually, the set MPS ranges between 60 and 70 percent.
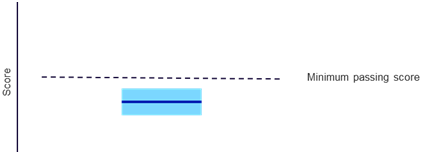
The second aspect of the new CFA result format is the confidence interval, representing a set of most probable values for candidates to attain in CFA exams. Based on the new format, the box shaded around the score represents a 90% confidence interval. Also, the confidence interval marks where the true ability of a candidate probably lies.
A candidate with a score and confidence interval above the MPS represents a candidate that can score very well and have high confidence in nearly any circumstances. On the other hand, a candidate with a score and confidence interval below the MPS portrays a candidate who scores poorly and needs to study much more and strategize adequately to pass in the future.
The candidate with a score below the MPS but with confidence interval overlapping the MPS illustrate a candidate with scores closer to the MPS and might have passed under some set of circumstances though would not have passed in most cases. With a little more studying, the candidate can turn the odds in his favor.
The third aspect is the 10th and 90th percentiles that show where the score of the total candidate pool falls within the percentile.
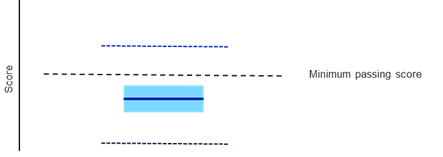
From the percentile above, you can conclude that 10% of the candidates for that particular exam performed well compared to the 90th percentile. Since the pass rate for the CFA exams is approximately 40%, the diagram above shows that about one in four passing candidates would perform above the 90th percentile line. Also, 10% of the candidates achieved below the 10th percentile, indicating that one in six candidates failed.
Another crucial element of the new CFA result format was how to conduct a topic breakdown from the performance chart. An individual could use the performance chart as a guide to prepare and effectively plan for their study if they know how to interpret the chart appropriately. First, a candidate can analyze their performance from the CFA results chart by considering the metrics of the 70% line.
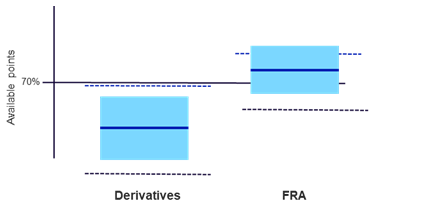
The CFA institute used 70% as the reference point since it does not have a minimum passing score for each topic area. Therefore, 70% represents available points for a particular topic. Even though the CFA institute perceives this level as somewhat arbitrary, a candidate consistently scores above the 70% line points to topic mastery. Additionally, analysis of the MPS score indicates that when a candidate reliably scores above 70% in all topic areas, such a candidate should expect a passing score.
From the diagram above, it is clear that broader score boxes representing confidence intervals indicate lower consistency. The diagram score boxes in the topic area charts are much more comprehensive compared to the resulting chart. The difference is due to fewer questions per chart and possibly wider response dispersion.
Even though the score boxes portray identical scores in the chart above, the scores on the right are much closer to the 90th percentile line, indicating better performance than those on the left. Consequently, a candidate can know the topic to focus on to improve their performance using the above diagram by evaluating their scores, the score boxes, and the scores of another candidate through the 90th and 10th percentile line. The candidate will identify which topics to focus on and work on them well to improve performance.
If you are considering earning a CFA charter, contact Analystprep.com and enroll in our study packages. You will gain access to a vast library of study materials to help you prepare for your exams. In addition, our online study notes and video lessons will help you assimilate the most complex concepts and pass on the first try.
Access CFA practice questions, mock exams, and study tools designed to strengthen exam strategy, improve weak areas, and build confidence for your next attempt.
Offered by AnalystPrep


The most common reading comprehension questions you will find on the verbal section... Read More

The Executive Master of Business Administration (EMBA) is a special mode of MBA... Read More
Get Ahead on Your Study Prep This Cyber Monday! Save 35% on all CFA® and FRM® Unlimited Packages. Use code CYBERMONDAY at checkout. Offer ends Dec 1st.