


Range of Practices and Issues in Econo ...
After completing this reading, you should be able to: Within the economic capital... Read More

After completing this reading, you should be able to:
The primary function of banks is not to buy and sell bonds but issuing loans. However, most loans are illiquid as they cannot be readily sold before maturity in case of an emergency. Moreover, loans are hazardous because of high customer default rates. Besides, for small and medium-sized depository institutions, loans come majorly from the local area. This implies that a substantial drop in local economic activities may weaken the quality of the average lender’s loan portfolio.
Most depository organizations, as well as other nonbank financial service providers such as insurance companies, pension funds, and mutual funds, invest a significant proportion of their asset portfolios in securities that are managed by investment officers. These investment securities include government bonds and notes, commercial paper, asset-backed securities arising from lending activity, domestic and Euro currency deposits, and certain kinds of common and preferred stock.
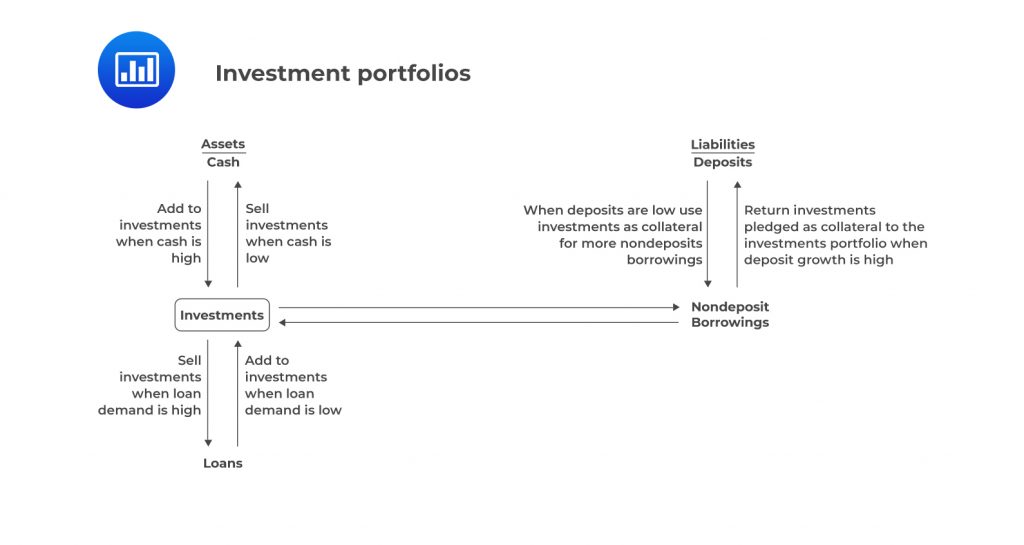
Investment portfolios play an essential role in the balance sheets of many financial institutions, as shown in the figure below.
 Investment Securities Available
Financial instruments differ in terms of expected yield, risk, sensitivity to inflation, and sensitivity to shifting government policies and economic conditions. Financial instruments are split into two categories:
Money market instruments are low-risk and readily marketable securities which have a maturity term of one year, whereas capital market instruments have a higher expected rate of return and capital gains potential with a maturity term of beyond one year.
U.S. Treasury bill is a debt obligation of the United States government that should mature in one year following the date of the issue. T-bills are issued in weekly or monthly auctions, and their high degree of security makes them very attractive. Moreover, they have relatively stable market prices and a ready market. Since T-bills are issued and traded at a discount from their par (face) value, the investor’s return solely consists of price appreciation as the bill approaches maturity.
Key advantages
Key disadvantages
Treasury notes have a relatively long original maturity of 1 to 10 years, whereas treasury bonds have a maturity term of over 10 years. These securities are considered money market instruments when they have a maturity term of within one year.
Key advantages
Similar to T-bills, they are safe securities and serve as good collateral for borrowing. However, they offer yields usually higher than T-bills. Additionally, they have a good resale market.
Key disadvantages
Short-term treasury notes and bonds are more sensitive to interest rate risk and less marketable than T-bills. Moreover, capital gains and income are subject to tax.
These are marketable notes and bonds sold by agencies owned by or sponsored by the federal government. They include securities issued by the Federal National Mortgage Association (Fannie Mae), the Farm Credit System (FCS), the Federal Land Banks (FLBs), and the Federal Home Loan Mortgage Corporation (Freddie Mac).
Key advantages
Federal agency securities are secure, have a good to the average resale market, and serve as good collateral for borrowing. Besides, they have higher yields than U.S. government securities.
Key disadvantages
Similar to short-term treasury notes and bonds, capital gains and income generated from federal agency securities is subject to tax. However, they are less marketable than Treasury securities.
A certificate of deposit is short-term security, which has a fixed interest rate and maturity date issued by a depository institution such as a bank to raise funds from the secondary money market. These securities carry a fixed term and a penalty for default.
Key advantages
Certificates of deposit (CD) are insured to at least $100,000. Furthermore, the yields are higher than that of T-bills. Finally, security dealers provide a secondary market for large denominations of CDs.
Key disadvantages
Longer-term CDs have a limited resale market. Further, the income generated is taxable.
These are typically short-term, fixed maturity deposits issued in million-dollar units by the world’s largest banks headquartered in financial centers around the globe (not necessarily in Europe).
Key advantages
These are low-risk securities with higher relative to many domestic CDs.
Key disadvantages
International euro currency deposits have volatile interest rates and a taxable income.
These are money market instruments that represent a bank’s promise to pay the holder a specified amount of money on a specified future date. They are among the most secure securities. A financial firm may decide to guarantee the credit of one of its customers who is exporting, importing, or storing goods or purchasing currency. The institution issuing the credit guarantee agrees to be the primary obligor. It is committed to paying off a customer’s debt in return for a fee.
Key advantages
Bank acceptances have a low risk due to multiple credit guarantees.
Key disadvantages
These securities have limited availability at specific maturities. Moreover, they are issued in odd denominations besides having taxable income.
This is a short-term debt instrument that is unsecured. A financial firm issues it, typically for the financing of accounts payable and inventories and meeting short-term liabilities. The commercial paper sold in the United States is of relatively short maturity—with most of it maturing in 90 days or less—and generally is issued by borrowers with the highest credit ratings.
Key advantages
Commercial paper is associated with low risk because it is always issued to borrowers with the highest credit rating.
Key disadvantage
Commercial paper experience market volatility, have a poor resale market, and the income earned is subject to tax.
These are a variety of short-term debt instruments issued by state and local governments to cover temporary shortages.
Key advantages
Municipal notes and bonds enjoy a tax-exempt interest income.
Key disadvantages
These securities have a limited resale market as well as taxable capital gains.
T-notes are investment instruments available in a wide variety of maturities ranging from 1 year to 10 years when issued and in large volumes. On the other hand, T-bonds, with original maturities of more than 10 years, are traded in a more limited market with wider price fluctuations. Both securities carry higher expected returns than T-bills. However, they present an investing institution with higher prices and liquidity risk.
Key advantages
These securities are secure, have a good resale market, serve as good collateral for borrowing, and may be pledged behind government bonds.
Key disadvantages
Treasury notes and bonds are low yielding relative to long-term private securities. Moreover, capital gains and income are taxable. There is also a limited supply of longest-term issues.
These are long-term debt obligations issued by states, cities, and other local governmental units. Interest earned on these notes and bonds is exempt from U.S. federal income tax provided that they are issued to fund public projects.
Key advantages
Interest on the majority of these bonds is exempt from U.S. federal income tax provided they are issued to fund public, not private, projects.
Municipal notes and bonds are secure because they purchase municipals from security dealers if their credit ratings are high.
Key disadvantages
Capital gains on municipals are fully taxable. Additionally, they are often not very liquid—relatively few issues trade on any given day.
Corporate notes are long-term debt securities with a maturity term of within five years issued by corporations. They are referred to as corporate bonds when they carry longer maturities. Their varieties depend on the types of security pledged, purpose, and terms of issue.
Key advantages
Corporate notes and bonds generally are more attractive to insurance companies and pension funds than to banks because of their higher credit risk. Moreover, they usually offer significantly higher yields than government securities.
Key disadvantages
They have a limited resale market. Further, their yield spread over governments widens when investors become more concerned about credit quality and economic downturns.
This is a debt security issued by financial firms. Its return depends on equity indexes, interest rates, commodities, or foreign currencies. These notes are complicated, thus resulting in substantial losses for some investing institutions, especially where interest rate risk is rising.
Key advantages
Coupons may be adjustable to reflect changes in interest rates in the future.
Key disadvantages
They are more complex than bonds and the potential for large losses exists.
Securitization is the procedure of pooling diverse types of contractual debt such as residential mortgages and commercial mortgages and selling their related cash flows to third-party investors as securities. These securities are described as pass-through securities, collateralized mortgage obligations (CMOs), and mortgage-backed bonds. Repayment to investors is obtained from the principal, and interest cash flows from the underlying debt. The repayments are redistributed via the capital structure of the new financing.
Securities backed by mortgage receivables are known as mortgage-backed securities (MBS), whereas those backed by other types of receivables are asset-backed securities (ABS).
Key advantages
Asset-backed securities have higher pretax yields than treasury securities. Moreover, they serve as collateral for borrowing additional funds.
Key Disadvantages
They are less marketable and more unstable in price than government securities. Besides, they carry substantial default risk and have taxable gains and income.
A stripped security is a claim against either the principal or interest payments associated with debt security, such as a Treasury bond. Stripped securities are created by separating the principal and interest payments from an underlying debt instrument and selling separate claims to these two promised income streams. They offer interest-rate hedging possibilities to help protect an investment portfolio against loss from interest-rate changes. Each stripped security is sold at a discount from par, so the investor’s rate of return is based solely on price appreciation.
Key advantages
Stripped securities offer interest-rate hedging possibilities to help protect an investment portfolio against loss from interest-rate changes.
Key disadvantages
They are sensitive to price fluctuations.
There are a few types of investment securities that dominate bank investment portfolios. These include:
Mortgage-loan-backed securities make up more than half of all U.S. bank investment holdings because of their relatively higher yields. The largest banks in the industry hold the highest concentration of these mortgage-related instruments. The smallest banks tend to invest more heavily in government securities than larger banks as expected. These instruments are the lowest-risk securities. Since the smallest banks tend to be more heavily exposed to the risk of loss from economic problems in their local areas, they use lower-risk securities to offset the high risk often inherent in their loans.
On the other hand, the largest banks invest more heavily in foreign securities and private debt and equity obligations, i.e., corporate bonds and commercial paper, all of which carry a higher exposure to risk relative to government securities.
Overall, investment securities account for only about a fifth of total assets. However, this proportion varies depending on the size and location of the bank. Banks located in areas with low loan demands typically hold a substantial, more significant proportion of investment securities relative to their total assets.
Moreover, smaller size banks hold a higher proportion of investment securities while larger banks hold a smaller proportion of their assets in investment securities, reflecting the relatively heavy loan demand most large banks face. It is crucial to note that after loans, the most significant source of revenue for most banks around the world is interest and dividends on investment securities.
When deciding on the investments to hold, investments managers must weigh multiple factors: (a) the goal of the investment portfolio; (b) expected rates of return; (c) tax exposure; (d) risks associated with changing market interest rates, with possible default by security issuers, with the possible need for cash at any time, with the impact of inflation and business cycle upon the demand for financial services, and with the prepayment of loans that can reduce expected returns. Here, we discuss these factors in detail.
The investment manager must determine the rate of return expected from investing in a given security, expected interest payments, and potential capital gains or losses. The manager does this by calculating the yield to maturity (YTM) for a security to be held to maturity or the holding period yield (HPY) between the point of purchase and the point of sale.
The yield to maturity formula determines the rate of discount (or yield) on a loan or security that equities the market price of the loan or security with its expected stream of cash flows (interest and principal). For example, suppose an investor wants to purchase an $800 par-value treasury note that has a 6% coupon rate (i.e., 0.06×800=$48) and is expected to mature in 6 years. If the current price of the Treasury note is $500, the yield to maturity is determined as follows:
$$ \begin{align*} 500 =& \cfrac {48}{(1+\text{YTM})^1} +\cfrac {48}{(1+\text{YTM})^2} + \cfrac {48}{(1+\text{YTM})^3} + \cfrac {48}{(1+\text{YTM})^4} \\ & +\cfrac {48}{(1+\text{YTM})^5} +\cfrac {(48+800)}{(1+\text{YTM})^6} \\ \end{align*} $$
Solving the above equation gives a YTM of 16.24%. The YTM should be compared with the expected yields on other loans and investments to determine the range of the best possible return.
For investments that are not held to maturity, the investments manager should work out the holding period yield (HPY). The HPY refers to the rate of return (discount factor) that makes a security’s purchase price equal to the stream of income expected until it is sold. For example, suppose an investor wants to purchase an $800 par-value treasury note that has a 6% coupon rate (i.e., 0.06×800=$48) and is expected to mature in 6 years. The current price of the Treasury note is $500. The investor decides to sell the security at the end of 3 years for $600 to another investor. Its holding period yield could be calculated as follows:
$$ 500=\cfrac {48}{(1+\text{HPY})^1} + \cfrac {48}{(1+\text{HPY})^2} +\cfrac {(600+48))}{(1+\text{HPY})^3} $$
In this case, the security’s HPY is 13.07%.
Interest and capital gains income from most investments are taxed as ordinary income for tax purposes. Banks are focused more on the after-tax rate of return on loans and securities than on their before-tax return because of their relatively high tax exposure. This is contrary to other institutions such as credit unions and mutual funds, which are tax-exempt.
Banks in the upper tax brackets, tax-exempt state and local government (municipal) bonds, and notes can be attractive, depending on their status in tax law and market conditions. An investments officer for a financial firm subject to the corporate income tax may compare potential yields of different bonds using the formula:
$$ \text{After-tax gross yield}=\text{Before-tax gross yield}×(1-\text{Firm’s marginal income tax rate}) $$
For example, suppose that Aaa-rated corporate bonds have an average gross yield to maturity of 6%, the prime rate on top-quality corporate loans is 5%, and Aaa-rated municipal bonds have a 4.5% gross yield to maturity.
From the above formula, we can compare each of these potential yields, the expected after-tax gross returns for a taxed financial firm in the top 35% federal income tax bracket is computed as follows:
Aaa-rated corporate bonds: \(6\%×(1-0.35)=3.9\%\).
Prime-rated loans: \(5\%×(1-0.35)=3.3\%\).
Aaa-rated municipal bonds: \(4.5\%×(1-0)=4.5\%\).
The municipal bond is the most attractive investment in gross yield under the assumption given.
Given municipal or tax-exempt security, an investment manager can calculate tax-equivalent yield (TEY). This measure indicates that the before-tax rate of return on a taxable investment provides the investor with a similar after-tax return as a tax-exempt investment would.
$$ \text{TEY}=\cfrac {\text{After-tax return on a tax-exempt investment}}{(1 – \text{Investing firm’s marginal tax rate})}$$
In the above example, the Aaa-rated corporate bond and the prime-rated loans would have to have a before-tax yield of 6.92% to match the Aaa-municipal bond’s after-tax yield of 4.50%.
Tax reforms have a significant effect on the relative attractiveness of state and local government bonds as investments for banks. Since the federal tax reform legislation in the United States, banks’ share of the municipal market has fallen substantially due to:
Bank-qualified bonds are those issued by smaller local governments, i.e., governments issuing no more than $10 million of public securities per year. Banks buying bank-qualified bonds are allowed to deduct 80% of any interest paid to fund these purchases. This tax advantage is not available for nonbank-qualified bonds.
Financial institutions evaluate the attractiveness of municipals by calculating the net after-tax returns or tax-equivalent yields. This enables comparisons with other investment alternatives. The net after-tax return of bank-qualified municipals is worked-out as follows:
$$ \begin{align*} \text{Net after-tax return on municipals} (\%) & =(\text{Nominal return on municipals after taxes}\\ & (\%)- \text{Interest expense incurred} \\ & \text{in acquiring the municipals} (\%)\\& + \text{Tax advantage of a qualified bond} \end{align*} $$
Where:
$$ \begin{align*} \text{Tax advantage of a qualified bond}&=\text{The bank’s marginal income tax rate}(\%) \\ &× \text{Percentage of interest expense } \\ &\text{that is still tax deductible}\\& × \text{Interest expense acquiring the municipals} (\%) \\ \end{align*} $$
In a tax swap, the lender sells lower-yielding securities at a loss to reduce its current taxable income, while at the same time purchasing new higher-yielding securities to boost future returns. Typically, larger lending institutions are in the top income-tax bracket and have the most to gain from security portfolio trades that minimize tax exposure.
Financial firms may shift their portfolios to substitute new, higher-yielding securities for old security holdings whose yields may be below current market levels. This may be to take substantial short-run losses in return for the prospect of higher long-run profits.
Increasing interest rates have various effects, including lowering the market value of previously issued bonds and notes and surging loan demand. The longest-term issues experience the most massive losses. Investment officers often find themselves purchasing investment securities when interest rates and loan demand are decreasing. Therefore, the prices investments officers must pay for desired investments are higher. Financial futures, options, interest-rate swaps, gap management, and duration are some of the financial tools used to hedge interest rate risk.
Credit risk refers to the risk that the other counterparty will default (i.e., fail to repay) on its loan payments or meet contractual obligations. Credit risk has led to regulatory controls that prohibit the acquisition of speculative securities. Speculative securities are those rated below Baa by Moody’s or BBB on Standard & Poor’s bond-rating schedule and below BBB on Fitch’s Rating Service as shown in the following figure:
$$\small{\begin{array}{l|l|l|l|l} {\textbf{Credit}\\\textbf{Quality}\\\textbf{of Securities}} & {\textbf{Moody’s}\\\textbf{Rating}\\\textbf{Category}}&{\textbf{Standard}\\\textbf{and}\\\textbf{Poor’s}\\\textbf{Rating}\\\textbf{Category}}&{\textbf{Fitch Inc.}\\\textbf{Ratings}\\\textbf{Category}}& \\\hline
\begin{array}[c]{@{}l@{}}\text{Best quality/}\\\text{smallest}\\\text{investment risk}\end{array} & \begin{array}{@{\labelitemi\hspace{\dimexpr\labelsep+0.5\tabcolsep}}l@{}}\text{Aaa}\end{array} & \begin{array}{@{\labelitemi\hspace{\dimexpr\labelsep+0.5\tabcolsep}}l@{}}\text{AAA}\end{array} & \text{AAA} & {\begin{array}{@{\labelitemi\hspace{\dimexpr\labelsep+0.5\tabcolsep}}l@{}}\text{Investment quality}\\\text{or investment}\\\text{grade/deemed}\\ \text{suitable for investment}\\\text{ by most banks}\\\text{and other highly}\\\text {regulated financial}\\\text{institutions.}\end{array}} \\ \begin{array}{@{\labelitemi\hspace{\dimexpr\labelsep+0.5\tabcolsep}}l@{}}\text{High grade or}\\\text{high quality}\end{array} & \text{Aa} & \text{AA} & \text{AA} & \\ \\
\begin{array}{@{\labelitemi\hspace{\dimexpr\labelsep+0.5\tabcolsep}}l@{}}\text{Upper medium}\\\text{grade}\end{array} & \text{A} & \text{A} & \text{A} & \\ \\
\text{Medium grade} & \text{Baa} & \text{BBB} & \text{BBB} & \\ \\
\begin{array}{@{\labelitemi\hspace{\dimexpr\labelsep+0.5\tabcolsep}}l@{}}\text{Medium grade}\\\text{and somehow}\\\text{speculative}\end{array} & \text{Ba} & \text{BB} & \text{BB} & \\\hline
\begin{array}{@{\labelitemi\hspace{\dimexpr\labelsep+0.5\tabcolsep}}l@{}}\text{Lower medium}\\\text{grade}\end{array} & \text{B} & \text{B} & \text{B} & {\begin{array}{@{\labelitemi\hspace{\dimexpr\labelsep+0.5\tabcolsep}}l@{}}\text{Speculative quality}\\\text{and junk bonds/deemed}\\\text{not suitable for banks}\\\text{and other highly}\\\text{regulated financial}\\\text{institutions.}\end{array}} \\\begin{array}{@{\labelitemi\hspace{\dimexpr\labelsep+0.5\tabcolsep}}l@{}}\text{Poor standing/}\\\text{may be in default}\end{array} & \text{Caa} & \text{CCC} & \text{CCC} & \\\\
\begin{array}{@{\labelitemi\hspace{\dimexpr\labelsep+0.5\tabcolsep}}l@{}}\text{Speculative/often}\\\text{in default}\end{array} & \begin{array}{@{\labelitemi\hspace{\dimexpr\labelsep+0.5\tabcolsep}}l@{}}\text{Ca}\end{array} & \begin{array}{@{\labelitemi\hspace{\dimexpr\labelsep+0.5\tabcolsep}}l@{}}\text{CC}\end{array} & \begin{array}{@{\labelitemi\hspace{\dimexpr\labelsep+0.5\tabcolsep}}l@{}}\text{CC}\end{array} & \\\\ \begin{array}{@{\labelitemi\hspace{\dimexpr\labelsep+0.5\tabcolsep}}l@{}}\text{Lowest grades}\\\text{speculative securities/}\\\text{poor prospects}\end{array} & \text{C} & \text{C} & \text{C} & \\\hline
\begin{array}{@{\labelitemi\hspace{\dimexpr\labelsep+0.5\tabcolsep}}l@{}}\text{Defaulted and}\\\text{bankrupt-company}\\\text{securities}\end{array} & \text{Not rated} & {\text{DDD}\\\text{DD}\\\text{D}} & {\text{RD}\\\text{D}} & \begin{array}{@{\labelitemi\hspace{\dimexpr\labelsep+0.5\tabcolsep}}l@{}}\text{Bankrupt or defaulted}\\\text{security issuers}\end{array} \end{array}}$$
To protect depositors against excessive risk, U.S. banks generally are allowed to buy only investment-grade securities, rated at least Baa or BBB. Many state and local governments seem to face an even greater risk of loss because of factors like high unemployment, depressed government revenues, declining support from the federal government for welfare programs, health services, and infrastructure needs, higher energy costs, and strong taxpayer resistance to higher taxes.
Credit options and swaps can be used to protect the expected yield on investment securities. For example, investment officers may find another financial institution willing to swap an uncertain return on securities held for a lower but more certain return based on a standard reference rate, such as the market yield on Treasury bonds. Credit options also help to hedge the value of a corporate bond, for example. If the bond issuer defaults, the option holder receives a payoff from the credit option that at least partially offsets the loss. Moreover, investment officers can also use credit options to protect the market value of a bond in case its credit rating is lowered.
Business risk is the exposure of the economy of the market area in a firm that operates, which may turn down, leading to falling sales and rising unemployment. The business risk may lead to a rise in delinquent loans as borrowers struggle to generate enough cash flow to pay the lender. Out-of-market security purchases may be used to balance risk exposure in the loan portfolio. For example, a bank located in Alaska may purchase a substantial quantity of municipal bonds from cities and other local governments outside the Midwest (e.g., Los Angeles or New York debt securities).
Liquidity risk is the risk of losses due to the need to liquidate positions to meet funding requirements. This occurs when financial firms are forced to sell investment securities in advance of their maturity due to liquidity needs. Liquid securities such as Treasury securities, which are the most liquid, have a ready market, relatively stable price over time, and a high probability of recovering the original amount invested.
Unfortunately, the purchase of a large volume of liquid securities tends to lower the average yield from a financial institution’s earning assets and reduce its profitability. Therefore, there is a trade-off between profitability and liquidity that must be reevaluated daily as market interest rates and exposure to liquidity risk fluctuate.
Call risk refers to the risk that the issuer of callable bonds redeems them before their maturity date. Callable bonds are related to call options, where the issuer has the right to redeem (call) the bond before maturity. Since these calls typically occur when the interest rates decline, meaning that the borrower can get lower interest costs, the institution investing in such bonds faces the risk of earnings loss since it should reinvest its recovered funds at lower interest rates. Call risk can be reduced by purchasing callable securities bearing longer call deferments or only by avoiding the purchase of callable securities.
As the name suggests, prepayment risk is the risk of early repayment of a loan by the borrower. It is specific to asset-backed securities that arise since the realized interest and principal payments from a pool of securitized loans may be different from the originally expected cash flows.
Mortgage-backed securities are a class of securities where the underlying is a pool of mortgages (home loans). In addition to the credit risk of a borrower defaulting on the loan, mortgages also have prepayment risk because the borrower has the option to repay the loan early (at any time), usually due to favorable interest rate changes. Investors in these securities collect interest payments made by the underlying home loans. Therefore, when the homeowners repay their loans earlier than expected, the investors face the risk of lower interest payments obtained from the underlying home loans.
For example, suppose that a homeowner takes out a mortgage at an interest rate of 12%. At the time of taking out a mortgage, the market interest rate was 12%. Two years later, the market interest rate is 9%. In this case, the lender faces prepayment risk on the mortgage due to the change in market interest rates from 12% to 9%. Assuming that there is no prepayment penalty, the homeowner has an incentive to refinance the mortgage from an interest rate of 12% to an interest rate closer to the current market interest rate of 9%. Therefore, the lender foregoes the interest payments (at the higher interest rate) that the homeowner will have made over the life of the mortgage.
Prepayment risk in this case can be reduced by imposing prepayment penalties on homeowners who repay their mortgage loans earlier than expected.
Rising prices of goods and services distort the purchasing power of interest income and repaid principal from security or loan. Moreover, inflation can erode the stockholders’ net worth.
Inflation risk can be mitigated by the use of short-term securities and those with variable interest rates, which usually grant the investment officer greater flexibility in responding to any flare-up in inflationary pressures. Treasury Inflation-Protected Securities are used to hedge inflation risk in the United States. Both the coupon rate and the principal (face) value of a TIPS are adjusted annually to match the fluctuations in the consumer price index. Unfortunately, TIPS does not protect investors from all the effects of inflation, such as moving into higher tax brackets. Moreover, they carry market risks like regular bonds but tend to be less liquid.
A Pledging requirement refers to any legal requirement for securities to be pledged as collateral for specific deposits. Depository institutions, for example, in the United States, reject deposits from federal, state, and local governments unless they post collateral, which is acceptable to these governmental units.
State and local government deposit pledging requirements differ widely from state to state, though most allow a combination of federal and municipal securities to meet government pledging requirements
If a financial institution uses repurchase agreements (RPs) to raise money, it must pledge some of its securities (usually Treasury and federal agency issues) as collateral to receive funds at the lowest RP rate.
After the investment officer has chosen the types of securities the financial firm should hold, the next step is to determine the maturities of the securities that the investing institution must hold. These may either be short-term bills and notes, only long-term bonds, or a combination of the two. Maturity distribution strategies that can be employed here include:
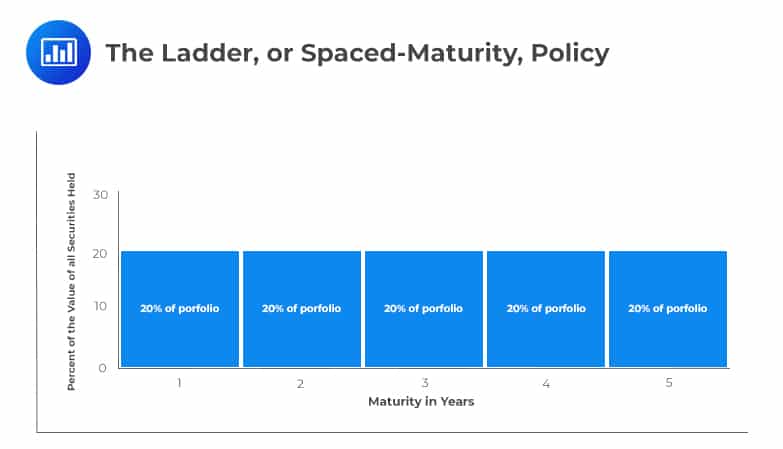
Under this approach, the strategy is to divide the investment portfolio equally among all maturities acceptable to the investing firm. Smaller institutions apply this approach.
The advantages of the ladder method are that it reduces income fluctuations, requires little expertise to carry out, and tends to build in investment flexibility. However, it fails to maximize investment income.
For example, suppose the management decides to purchase bonds or notes with maturities no longer than 5 years. It might then decide to invest 20% of the investment portfolio in securities one year or less from maturity, another 20% in securities maturing within two years but no less than one year, another 20% in the interval of two to three years, until the five-year point is reached. This can be demonstrated in the following chart.
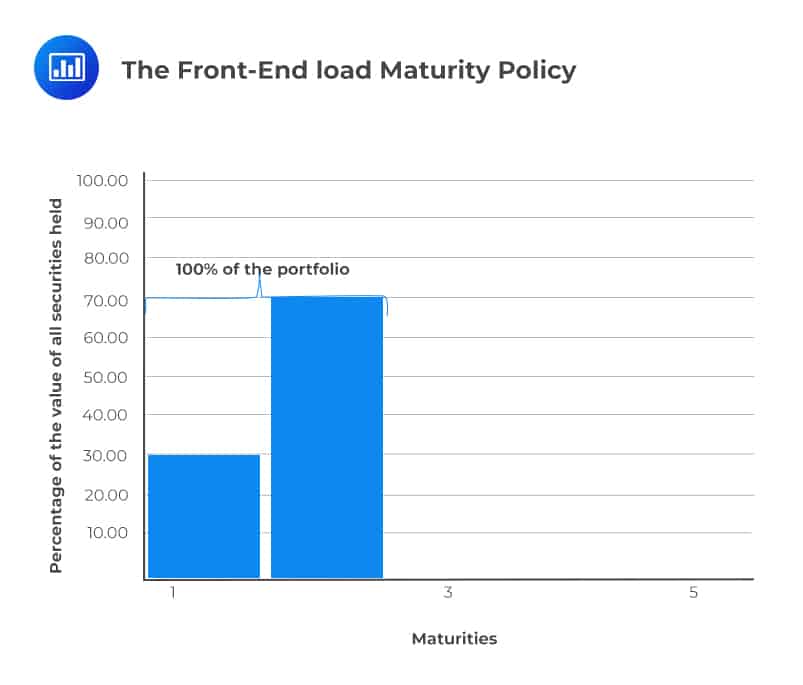
This strategy involves purchasing short-term securities only and placing all investments within a short interval of time. The method has the advantage of strengthening the liquidity position of a financial institution and avoids significant capital losses in case of a rise in the market interest rates.
For example, the investment officer may decide to invest 100% of the institution’s funds not needed for loans or cash reserves in securities not more than 3 years from maturity.
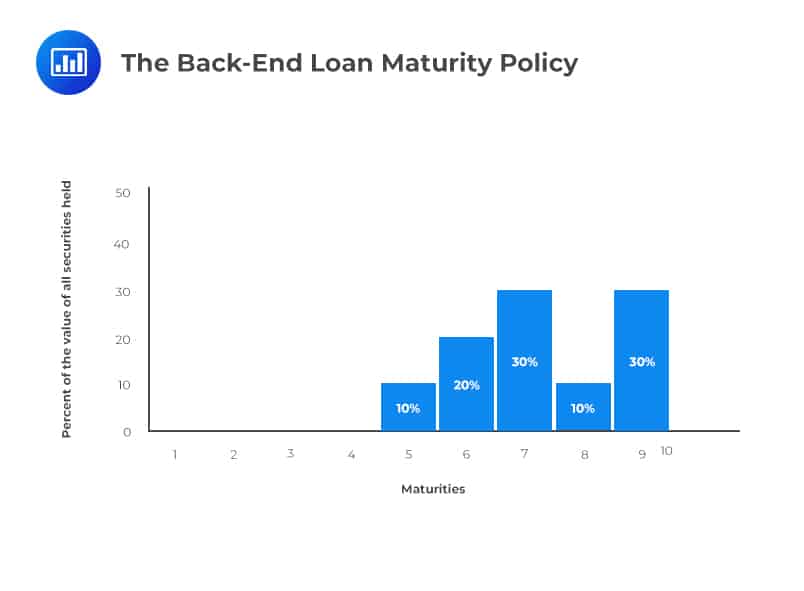
This approach stresses the investment portfolio as a source of income, and all security investments are long term contrary to the front-end load maturity policy approach. An investing firm following the back-end load approach might decide to invest only in bonds that have a maturity range of 5-10 years. This firm is most likely to rely heavily on borrowing in the money market to help meet its liquidity requirements. This strategy applies when the interest rates are believed to increase. The following chart illustrates the back-end load maturity policy.
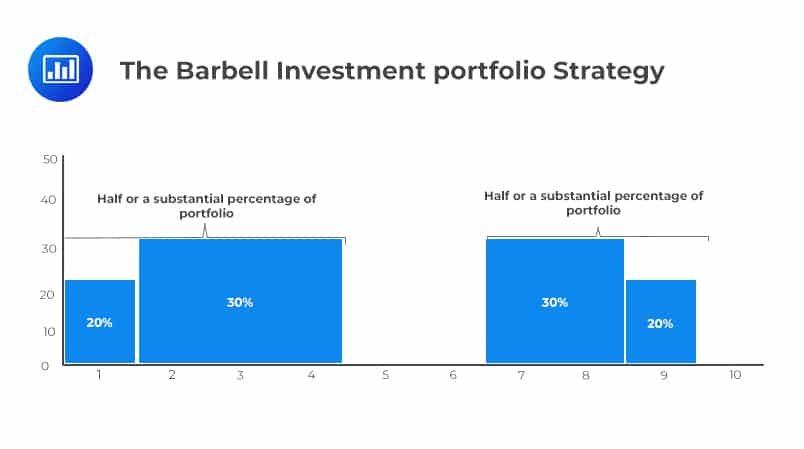
The barbell strategy is a combination of front-end and back-end load approaches, and smaller financial firms often use it. The investing institution places most of its funds in a short-term portfolio of highly liquid securities at one extreme and in a long-term portfolio of bonds at the other extreme, with minimal investment holdings in intermediate maturities. This strategy has the advantage of helping to meet liquidity needs with short-term securities and to create income using the long-term portion of the portfolio.
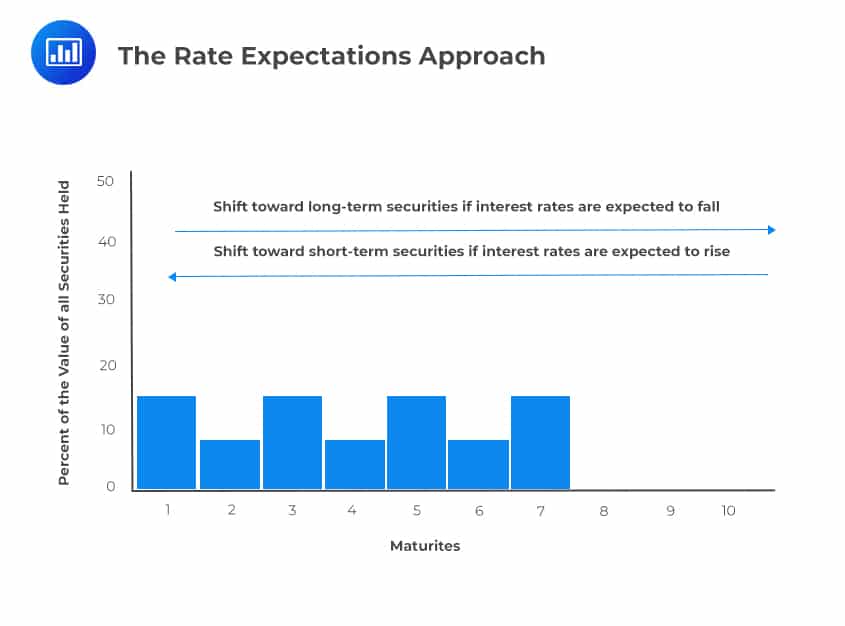
The largest financial firms use this strategy. The rate expectations approach continually shifts maturities of securities in line with current forecasts of interest rates and the economy. When interest rates are expected to rise, this strategy shifts the investments towards the short end of the maturity spectrum and toward the long end when interest rates are expected to fall. This approach maximizes the potential for earnings. However, it raises the specter of substantial losses. Moreover, it requires in-depth knowledge of market forces, presents a higher risk if expectations turn out to be wrong, and carries higher transaction costs because it may require frequent security trading and switching.
The yield curve and duration are essential maturity tools that help the investment officer to understand the consequences and potential impact upon earnings and risk from any particular maturity mix of securities fully.
The yield curve refers to a curve that demonstrates the relation between the interest rate and the term to maturity. More specifically, it shows how market interest rates differ across loans and securities of different terms to maturity. The curve assumes that all the yields (interest rates) included along the curve are measured at the same time. Additionally, all the other rate-determining factors are held fixed.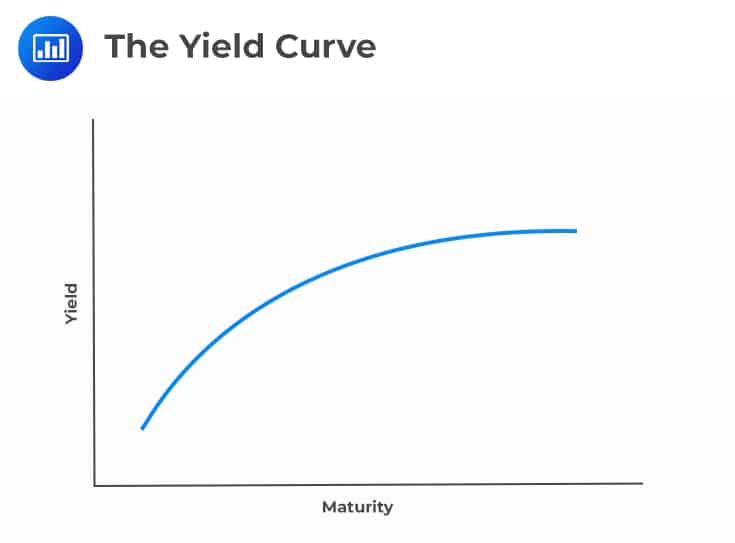
The yield curve acts as a guideline for other loans in the market, such as bank lending rates or mortgage rates. Moreover, it is used to predict changes in economic output and growth. Yield curve shapes have critical implications for the decisions an investment officer must make.
Positively sloped yield curves imply that the future short-term interest rates are expected to be higher than they are today.
Investors expect an upward movement in the interest rates; therefore, they shift their investment holdings from longer-term securities, which are expected to incur capital losses when market interest rates rise.
On the other hand, a downward-sloping yield curve implies that the investor expects a decline in the short-term interest rates in the period ahead. Therefore, he/she lengthens the portfolio maturity because falling interest rates imply substantial capital gains income from the longer-term investments.
Furthermore, yield curves give a clue about overpriced and underpriced securities. A security whose yield lies above the yield curve implies that its price is too low with a temporary high yield. Conversely, a security whose yield lies below the curve represents a ‘don’t buy’ situation because its yield is too low for its maturity, and thus its price is too high.
Yield curves rise in economic expansions and fall in recession. Therefore, they can be used to determine the stage of the business cycle the economy presently occupies.
The yield curve’s shape determines the additional yield the investments officer can earn by replacing shorter-term securities with longer-term issues or vice versa. Longer-term securities have higher price volatility relative to shorter-term securities; thus, an investor must be willing to accept a higher risk of a capital loss for longer-term security if interest rates rise.
Additionally, longer-term bonds have a thinner market when cash needs to be raised urgently, leading to a liquidity crisis (cash-out) or capital losses if interest rates go in an unexpected direction.
A carry trade is an investing strategy that entails borrowing short-term money (at a low-interest rate) using the safest and most liquid investment securities in the firm’s portfolio as collateral and then investing the borrowed funds in income-generating assets farther out along the curve (provides a higher rate of return). The difference between these two return rates is called carry income and tends to be highest when the yield curve has an upward slope, which is steep.
This is an investment strategy in which the investment firm buys a long-term bond and sells it before maturity. Riding the yield curve allows the investing firm to profit from the declining yield that occurs over the life of the bond. For example, the investment officer identifies a situation in which some securities are soon to approach maturity, and their prices have risen significantly while their yields to maturity have fallen.
If the yield curve’s slope is steep enough to cover transaction costs more than adequately, the investing firm can sell those securities, reaping a capital gain due to the recent rise in their prices, and reinvest the proceeds of that sale in longer-term securities carrying higher rates of return. If this maneuver works (i.e., the slope of the yield curve does not fall), the investing institution reaps both higher current income and greater future returns.
Duration is a present-value-weighted measure of the maturity of an individual security or portfolio of securities. It measures the average amount of time needed for all of the cash flows from a security to reach the investor who holds it. In other words, it measures a security’s price sensitivity to interest rate changes.
A critical relationship exists between duration, market interest rates, and investment security prices, as depicted in the following formula.
$$ \text{Percentage change in price}=-\text{Duration}×\cfrac { \text{Change in interest rate})}{1+ \left(\frac {1}{\text m} \right)(\text{Initial rate)} } $$
Where \(m\) is the number of times in a year that the security pays interest. For example, if bonds pay interest semiannually, \(m = 2\).
Given an investment, the investment officer must decide how much chance there is that market interest rates rise, whether this degree of price sensitivity is acceptable, and whether other investments would better suit the institution’s current investment needs.
Immunization is a risk-mitigating strategy that matches the duration of an investment’s assets and liabilities. This reduces an institution’s exposure to interest rate risk. It suggests a formula for minimizing interest rate risk:
Duration of an individual security or a security portfolio = Length of the investor’s planned holding period for a security or a security portfolio
Portfolio immunization is a strategy that involves protecting securities purchased from loss of return, no matter which way interest rates go. The investment officer should focus on the tradeoff between price risk and reinvestment risk in an investment portfolio.
Practice Question
The investment strategy that involves purchasing short-term securities only and placing all investments within a short interval of time is known as?
A. The ladder or spaced-maturity policy.
B. The front-end load maturity policy.
C. The back-end load maturity policy.
D. The barbell investment portfolio strategy.
The correct answer is B.
The front-end load maturity policy involves purchasing short-term securities only and placing all investments within a short interval of time. The method has the advantage of strengthening the liquidity position of a financial institution and avoids significant capital losses in case of a rise in the market interest rates.
A is incorrect. The ladder or spaced-maturity policy entails dividing the investment portfolio equally among all maturities acceptable to the investing firm.
C is incorrect. The back-end load maturity policy is an investment maturity strategy that requires the bank to hold all its investment assets in long term maturities.
D is incorrect. The investment maturity strategy, which requires the bank to have one half of its investment portfolio in short term assets and one half of its investment portfolio in long term assets, is known as the barbell investment portfolio strategy.
Things to Remember
- The front-end load maturity policy is tailored to short-term securities investments.
- All investments under this strategy are placed within a condensed timeframe.
- This approach bolsters a financial institution’s liquidity position, making it more resilient to sudden cash needs or withdrawals.
- It acts as a buffer against considerable capital losses that might arise if market interest rates were to increase.
Access FRM study notes, practice questions, mock exams, and video lessons to strengthen your understanding of the investment function in financial services management.
Offered by AnalystPrep


Get Ahead on Your Study Prep This Cyber Monday! Save 35% on all CFA® and FRM® Unlimited Packages. Use code CYBERMONDAY at checkout. Offer ends Dec 1st.