







Liquidity and Leverage
> After completing this reading, you should be able to: Differentiate between sources... Read More

After completing this reading, you should be able to:
VaR is the maximum dollar-earnings potential associated with a given level of statistical confidence over a given period. In other words, VaR represents the maximum possible loss on a portfolio over a specified period in the future with a given degree of confidence. So, for example, a 95% five-day VaR is the maximum loss on a portfolio over five days with 95% confidence, i.e., there is a 5% probability of a greater loss.
VaR is expressed as dollar value-at-risk by finding the product of VaR and the assets under consideration. Therefore, for a specified duration and level of confidence, the capital owners can approximate the effect of the losses that are likely to occur. They can also spread capital among the asset classes to attain their expected levels of dollar VaR.
Tracking error, also known as active risk or tracking risk, is the standard deviation of the active return. Active return is calculated as the difference between the portfolio return and the return on the benchmark. If the difference is normally distributed, 67% of all outcomes will be within the benchmark’s returns plus or minus a unit standard deviation.
$$ \text{Active return}={ \text{R} }_{ \text{P} }-{ \text{R} }_{ \text{B} } $$
Where:
Thus,
\[
\text{Tracking Error} = \sqrt{ \frac{1}{n – 1} \sum_{i=1}^{n} (\text{R}_\text{{P, i}} – \text{R}_\text{{B, i}})^2 }
\]
Both VaR and Tracking Error are risk measures. Moreover, both measures may assume a normal distribution of returns. VaR is measured for shorter periods. On the other hand, tracking error is measured in terms of monthly returns.
While VaR is usually measured as a dollar amount of loss that can occur with a given probability, tracking error is measured in percent relative to the benchmark. However, “tracking VaR can be calculated,” which is also measured relative to the benchmark. Tracking VaR is usually expressed in terms of return, rather than an absolute amount of money the portfolio may lose.
Therefore, the tracking error can be seen as a special case of tracking VaR, where the confidence level and holding period are fixed.
Risk planning is one of the three pillars of risk management. The other risk management pillars include risk budgeting and risk monitoring. Each of them is responsible for the overall achievement of an organization.
While the strategic plan of an organization gives the targets for earnings among other aspirations of that particular organization, a risk plan is a framework designed to control the impacts of risky events. A risk plan must be treated as a distinct section of the strategic plan and should be scrutinized like any other section of the plan.
The following are the five risk planning objectives that any entity should consider.
The effect of risk planning include:
A risk budget is designed to give form to the risk plan. After creating a risk plan, the budget must be brought in to provide a proper allocation of risk capital to help the organization meet its objectives. For the return on equity (ROE) and return on risk capital (RORC) to be acceptable, they must outstep their minimum levels.
When developing a risk plan, the organization should factor in the following guidelines:
Risk budgeting makes use of elements of mathematical modeling. Quantitative methods may be seen as not sufficiently reliable for use as risk control tools. This is because they are prone to failure in worst-case scenarios. However, budget variances occur consistently in financial and risk budgeting. Budget variances may be due to inefficiencies or completely unforeseen anomalies.
Quantitative methods in risk budgeting include:
Variance monitoring is the act of identifying unusual deviations from the expectation due to scarcity in revenue and expense dollars. Notably, variances from the risk budget hinder the ability of the investment to attain its ROE and RORC targets. Risk monitoring is important in detecting variations in the risk budget.
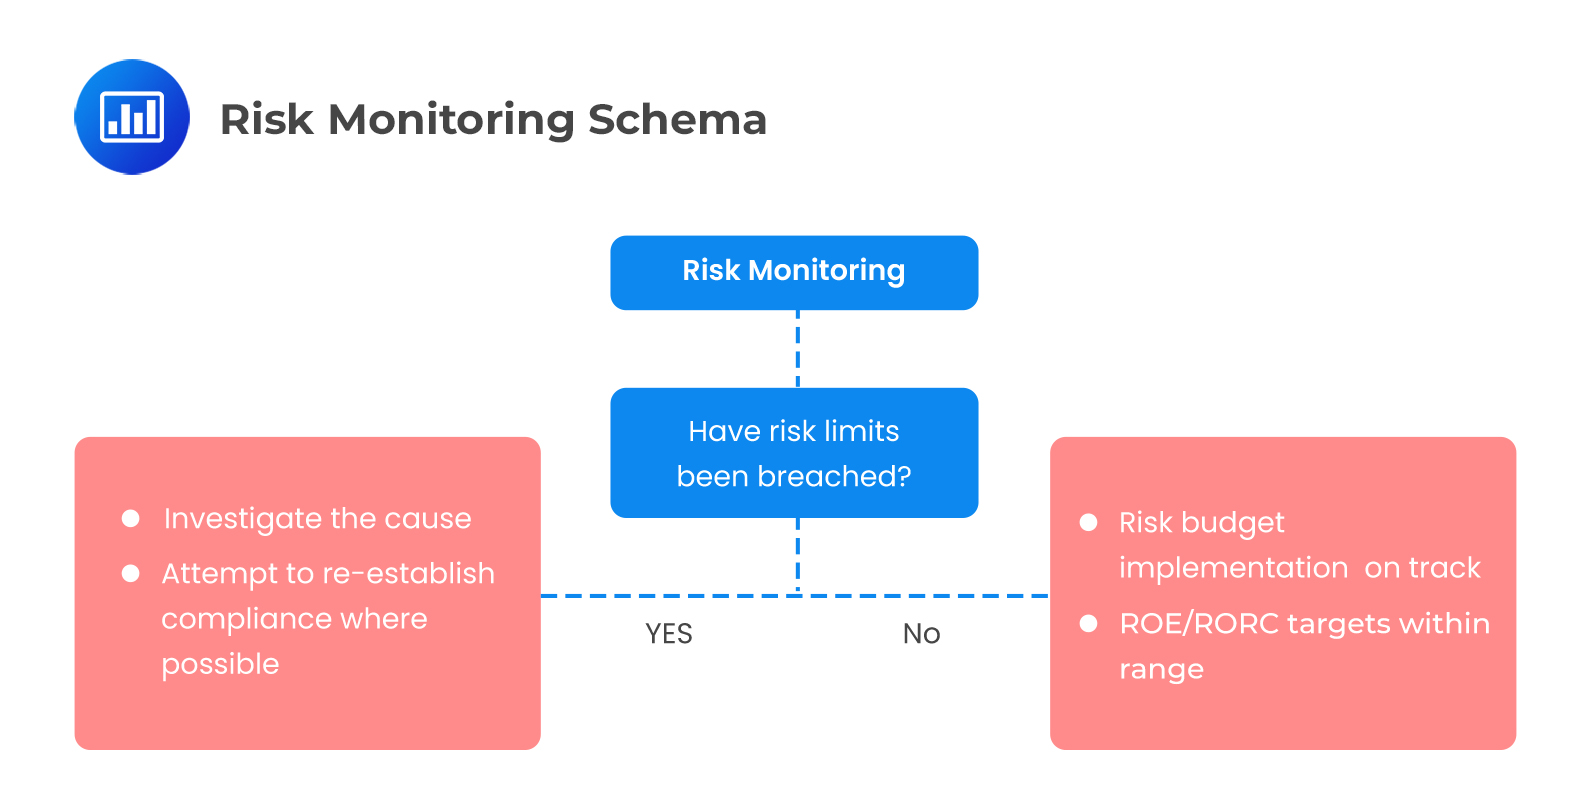 The Role of Risk Monitoring in the Internal Control Environment
The awareness and knowledge of risks are broadening within and across organizations.
Afterward, several organizations formed independent risk management units (RMUs) to respond to the increased level of risk consciousness. The RMUs survey the risk exposures of portfolios and ensure the exposures are authorized and consistent with the risk budgets.
The objectives of the RMUs are as follows:
In conclusion, RMUs are beneficial in measuring the degree to which asset managers trade based on product objectives, management’s expectations, and the clients’ mandate. In case an abnormal risk profile is identified, RMUs report it to the relevant authorities.
The internal control environment of an organization is considered effective if there is a timely, meaningful, and accurate flow of information between the senior management and the entire organization. A business is effective if it can minimize loss and maximize profit. Therefore, the risk management unit gives information on whether or not the investment activities meet their expectations.
The RMUs are also important for developing systems to report risk information to the senior management, or portfolio managers on whether investment activities are in line with the targets.
Is the forecasted level of tracking error generated by the manager in line with the target? Tracking error forecasts and tracking error budgets should be compared, and standards should be set to determine the magnitude of deviation from the target, which is considered unusual.
Is risk capital allocated to the expected areas? It is not enough to know that the overall expense is consistent with the target in financial variance monitoring. Instead, each line that forms the total cost must correspond to the expectation.
Using a similar principle to risk monitoring, managers should be able to specify both overall tracking error expectations and those of their constituents. As such, the manager will be at ease in telling whether the risk incurred is consistent with the target at constituent levels and the total. It is concluded that the manager is not investing in line with the philosophy if the risk constituents are not consistent with the expectations.
Historical simulation can be used to assess the behavior of a portfolio during periods of stress by comparing the current and past positions. However, this method is insufficient because the observed history limits examination to only one set of outcomes.
Monte Carlo’s approach can be used to examine multiple outcomes that are probabilistically implied by one set of outcomes. If the level of tracking error is large, to portfolio must be operated at a lower risk profile.
The liquidity profile of the portfolio changes when exposed to adverse market environments. As such, the tools for evaluating portfolio liquidity become important for stress analysis.
The liquidity duration statistic is applied at Goldman Sachs Asset Management (GSAM) to examine the implications of liquidity.
The statistic is computed by first approximating the average number of days required to liquidate a portfolio, i.e., the liquidity duration.
Assume that a risk manager does not wish to exceed 15% of the daily volume in any given security holding, the liquidity duration of security i is given by:
$$ \text{LD}_{ \text{i} }=\cfrac{ { \text{Q} }_{ \text{i} }} {\left(0.15 \times { \text{V} }_{ \text{i} } \right)} $$
Where:
\({ \text{LD} }_{ \text{i} }\) is the security duration statistic for asset i.
\({ \text{Q} }_{ \text{i} }\) is the number of shares held in security i.
\({ \text{V} }_{ \text{i} }\) is the daily volume of security i.
Moreover, we can estimate the portfolio’s overall liquidity duration by weighting the liquidity duration of each security by the weight of that security in the portfolio.
Calculate the liquidity duration for a given security, assuming that a risk manager does not wish to exceed 10% of the daily volume in that security, given that there are 10,000 shares held in that security and that the daily volume is 1,000 shares.
$$ \text{LD}=\cfrac{ \text{Q} } {0.10 \times { \text{V} } }= \cfrac {10,000}{0.10 \times1,000}=100 $$
Performance measurement involves comparing the portfolio manager’s actual results with the benchmarks and peer groups. Performance measurement aims to determine whether a manager can consistently outperform the market (benchmark) on a risk-adjusted basis. Moreover, it establishes whether a manager consistently outperforms their peer group on a risk-adjusted basis.
Performance measurement is considered a form of risk validation in cases where the forecasts are relevant. When computing a risk-adjusted performance measure, the returns for the relevant period and the risk incurred to achieve the returns must be known.
The following are the major performance tools and techniques:
The green zone is used at GSAM for identifying instances of performance tracking error that is beyond normal expectations. The elements embodying the green zone include:
Performance attribution is the most popular tool for measuring the quality of returns. Variance analysis is a form of attribution that shows how each security has contributed to the portfolio’s overall performance. This analysis is used by RMU professionals to determine whether the portfolio was going to get returns from the securities. The attribution process takes the weightings in risk factors periodically and accumulates the returns to those factors to produce a variance analysis expressed in factor terms.
Therefore, factor risk analysis and factor attribution have a meaning for managers who think in the risk factor space. Risk forecasting and attribution will be meaningful for those who think about risk based on individual securities.
The Sharpe and information ratios are designed to provide estimates of risk-adjusted returns, where the Sharpe ratio is the proportion of returns of a portfolio above the risk-free rate relative to the portfolio deviation. On the other hand, the information ratio is the proportion of the portfolio’s excess returns relative to the portfolio’s tracking error.
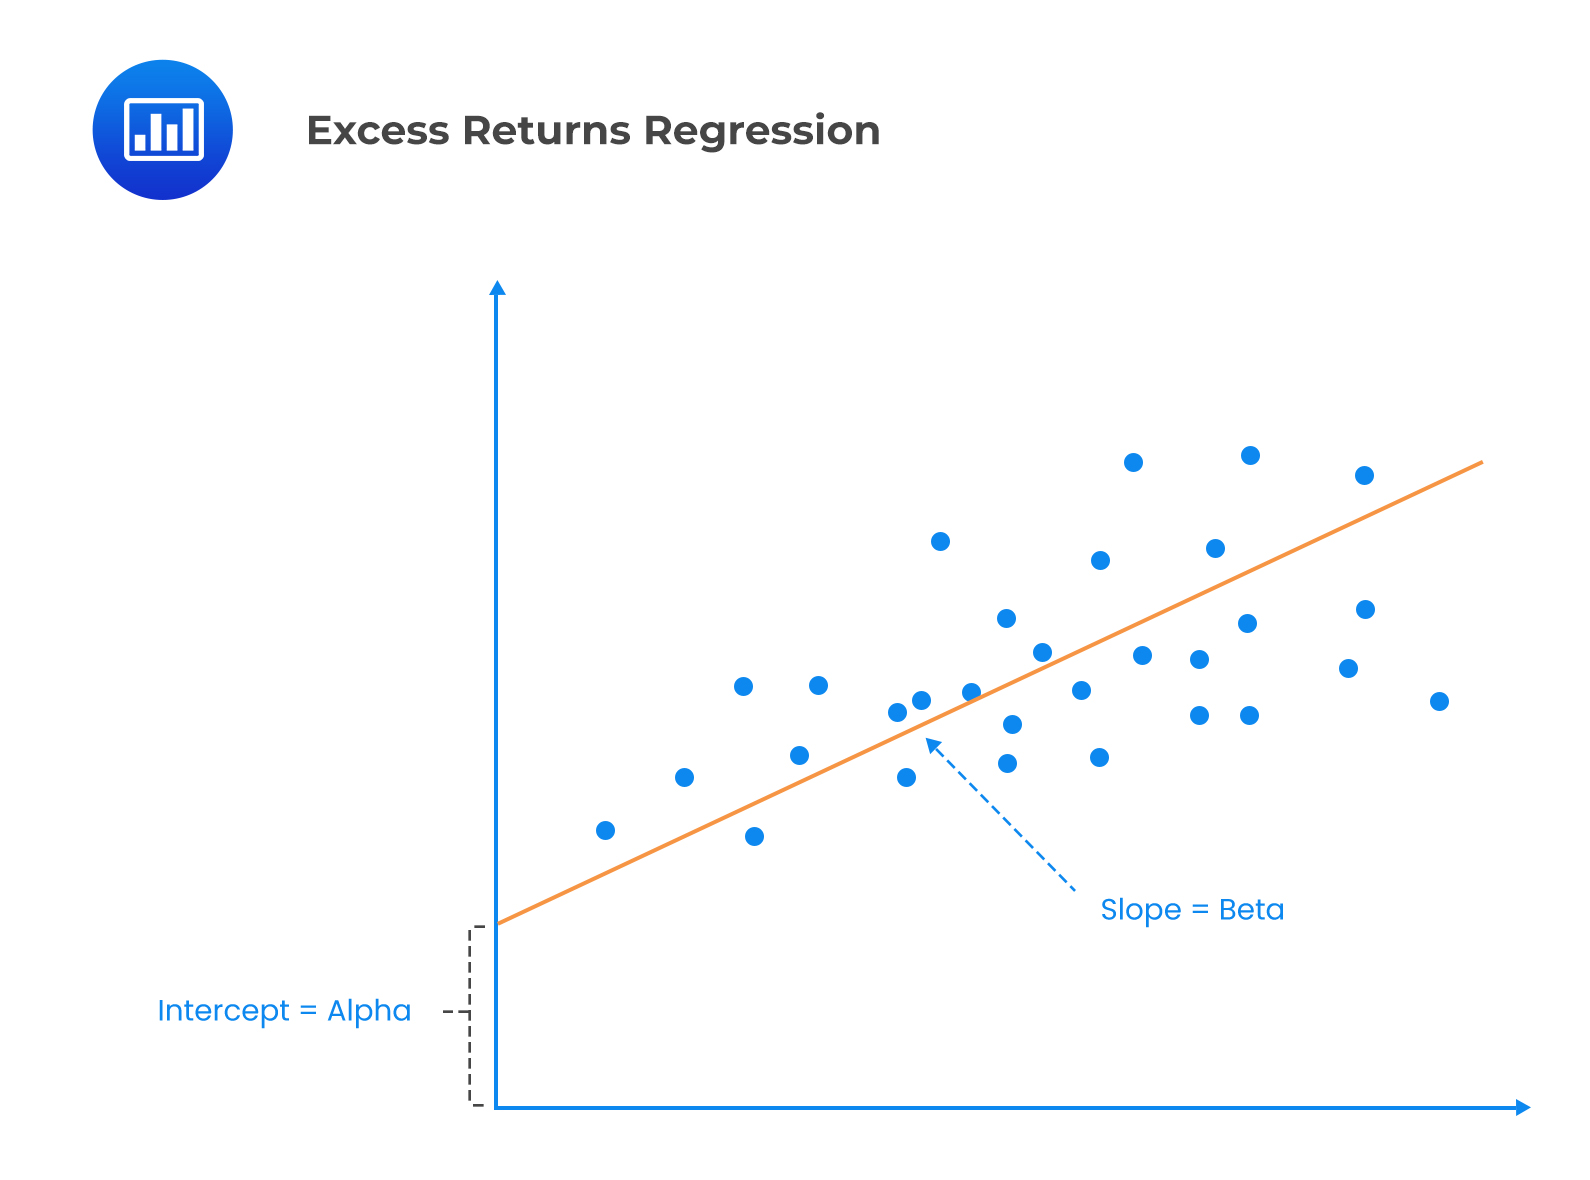
Here, the fund’s excess returns are regressed against the benchmark’s excess returns. The results of the regression include Alpha, which is an intercept, also known as skill, and Beta, which is a slope coefficient against the benchmark’s excess returns. The statistical significance of the alpha term can be tested to check whether it is positive and statistically different from zero.
 Strengths
This tool is used to find out if the manager shows skill over what is in the peer group. Here, the manager’s excess returns are regressed against the excess returns of the manager’s peer group.
A peer group is the manager’s opponent in his strategy, and the peer group’s return is the capital-weighted average return of all managers trading similar strategies.
The outputs of the regression of this tool include Alpha and Beta. Alpha is the intercept, also known as skill. It represents the manager’s excess returns against the peer group. On the other hand, Beta is the slope coefficient against the excess returns of the peer group. It measures the degree to which a manager uses greater or lesser amounts of leverage, compared to his peer groups.
As highlighted in the previous section, the objectives of performance measurement include:
Practice Question
At Stellar Asset Management, a firm that recently expanded its operations globally, the senior risk management team is in the process of revising its risk management framework. They aim to align it more closely with the challenges and intricacies of the international market. As part of this process, they’re revisiting the foundational pillars: risk planning, risk allocation, and risk oversight. During their meeting, they emphasize the importance of creating a detailed and comprehensive risk plan.
Given the scenario above, which of the following statements accurately reflects best practices in risk management?
A. Within a risk plan, integrating qualitative scenario analyses can effectively highlight potential weak points that might undermine its successful execution.
B. Although a risk plan can outline volatility objectives, it shouldn’t weave in the ramifications of crucial organizational ties on these objectives.
C. Exceptional and infrequent events ought to be excluded from a risk plan and reserved exclusively for its overarching operational strategy.
D. A risk plan must precisely gauge return on equity by solely assessing the return on risk assets for each specific segment in isolation.
Solution
The correct answer is A.
Incorporating qualitative scenario analyses in a risk plan provides a robust framework to proactively detect and address potential vulnerabilities. These analyses serve to simulate a spectrum of scenarios, especially challenging ones, to understand their potential repercussions on the firm’s risk position, ensuring better preparedness.
B is incorrect. An effective risk plan not only sets forth volatility objectives but also takes into account the potential impact of vital organizational ties on these objectives. Recognizing and accounting for these relationships is fundamental to formulating a risk plan that is both holistic and aligned with the organizational ecosystem.
C is incorrect. Exceptional events, regardless of their frequency, are integral to a risk plan. Their inclusion ensures that the firm is equipped with strategies and contingency measures to navigate the challenges that such events can introduce, underscoring the proactive essence of risk management.
D is incorrect. When developing a risk plan, it’s pivotal to adopt an integrated view on risk allocations when determining return on equity. Analyzing each segment in isolation might overlook the intricacies and interdependencies between different risk assets, leading to a potentially skewed risk assessment.
Things to Remember
- Incorporating qualitative scenario analyses in a risk plan helps in proactively identifying and addressing potential vulnerabilities.
- Scenario analyses simulate diverse situations, enhancing preparedness by understanding potential impacts on a firm’s risk position.
- An effective risk plan should consider the influence of vital organizational ties on volatility objectives.
- Understanding and accounting for these relationships ensures a risk plan that’s comprehensive and in harmony with the organizational ecosystem.
Strengthen your understanding of VaR, tracking error, risk monitoring, portfolio performance measurement, and risk management with FRM study notes, practice questions, mock exams, and video lessons.
Offered by AnalystPrep





Get Ahead on Your Study Prep This Cyber Monday! Save 35% on all CFA® and FRM® Unlimited Packages. Use code CYBERMONDAY at checkout. Offer ends Dec 1st.