


Alternative Exit Strategies.
Private investments, such as private equity and real estate, go through a life... Read More

Quantitative investing, also known as systematic or rules-based investing, is a structured investment process that starts with a hypothesis. For instance, an investor might hypothesize that companies with low price-to-earnings ratios outperform the market. To test this, the investor collects data from various sources like financial reports, market indices, and economic indicators. This data collection process requires meticulous management and data science skills to handle missing values and outliers.
After data collection, the investor creates quantitative models, mathematical representations of the hypothesis, to predict potential investment returns. For example, a linear regression model might be used to predict the relationship between a company’s price-to-earnings ratio and its stock returns. The investor must be comfortable with the investment value predicted by their models before proceeding.
The final step involves combining the return-predicting models with risk controls to construct the portfolio. This balances the potential returns predicted by the models with the investor’s risk tolerance. The goal is to maximize returns while minimizing risk.
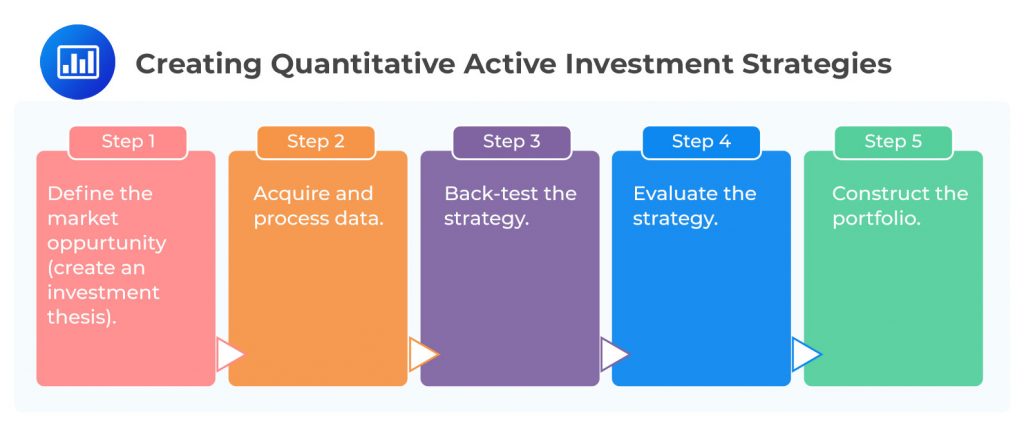
Quantitative active investing targets market opportunities by leveraging public data and specific factors to forecast stock returns effectively. Unlike fundamental active investing, this approach assumes markets are competitive yet imperfectly efficient. It involves constructing sophisticated models to anticipate future stock performance, underscoring the crucial role of high-quality, accurate public information in identifying promising investment avenues.
In quantitative investing, effective data management is critical, involving database creation, data mapping, understanding availability, cleaning, and formatting for analysis.
Data often requires extensive checks for consistency, error cleaning, and transformation into a format suited for quantitative analysis.
Back-testing employs historical data to test investment strategies by simulating past investing scenarios. It involves constructing portfolios, like one based on Apple Inc. stocks, and tracking their performance over time, with periodic rebalancing, such as quarterly. This method allows for evaluating a strategy’s effectiveness. Key to successful back-testing is the use of accurate and relevant data, alongside precise calculations for rebalancing based on the strategy’s defined rules.
The Information Coefficient (IC) is a crucial measure used in quantitative back-tests to evaluate factor performance. It operates under the assumption that expected returns are linearly related to factor exposures. Essentially, it is the correlation between factor exposures and their holding period returns for a cross section of securities. The IC provides a comprehensive view of factors across all securities in the investment universe, unlike a quantile-based approach that only captures the top and bottom extremes.
The Pearson IC is the simple correlation coefficient between the factor scores (standardized exposures) for the current period’s and the next period’s stock returns. For instance, in the context of US equities, a factor with an average monthly IC of 5%–6% is considered very strong. However, the Pearson IC is sensitive to outliers.
On the other hand, the Spearman rank IC, which is the Pearson correlation coefficient between the ranked factor scores and ranked forward returns, is often preferred by practitioners. This is because the Spearman rank IC is less sensitive to outliers and can therefore provide a more accurate measure of a factor’s predictive power for subsequent returns.
In the creation of a multifactor model, portfolio management relies on the strategic selection and weighting of various factors, either through qualitative insights or systematic analysis. This process, essential for a strategy’s success, involves treating each factor as an asset, an approach suggested by Qian, Hua, and Sorensen in 2007, which aligns factor weighting with asset allocation principles. However, it’s critical to assess the correlation between factors, as high correlation may lead to redundancy and diminish the efficiency of the model, underscoring the complexity and precision required in constructing an effective multifactor model.
Once a trading strategy has been back-tested, it’s crucial to evaluate its performance using an out-of-sample back-test. This involves testing the strategy on a different data set to confirm its robustness. However, it’s worth noting that a strategy that performs well in out-of-sample testing may not necessarily excel in live trading. To form an opinion on the outcome of their out-of-sample back-test, managers typically calculate various statistics such as the t-statistic, Sharpe ratio, Sortino ratio, Value at Risk (VaR), Conditional Value at Risk (CVaR), and drawdown characteristics.
Quantitative investment strategies have unique benefits and drawbacks. It’s essential for investors to understand potential pitfalls when evaluating these strategies. Wang, Wang, Luo, Jussa, Rohal, and Alvarez (2014) offer a comprehensive analysis of common issues in quantitative investing.
Back-testing is a prevalent practice in financial analysis, often conducted in an ideal, yet unrealistic world devoid of transaction costs, constraints on turnover, or limits on the availability of long and short positions. However, in the real world, managers often face numerous constraints such as limits on turnover and difficulties in establishing short positions in certain markets. The ability to capture a model’s expected excess return in a live trading process may depend on the rate at which their signal decays.
Trading is not free. Transaction costs can significantly erode returns. For instance, consider the case of a hedge fund implementing a short-term reversal strategy in the Japanese equity market. This strategy may be effective, but once transaction costs of 30 bps per trade are factored in, the return of the reversal strategy drops sharply. Conversely, the return of a price-to-book value strategy drops only modestly when considering the same transaction costs.
Practice Questions
Question 1: The market dynamics often involve a rapid growth of earnings from a very low base, followed by a significant slowdown. This slowdown could be attributed to various factors. In the context of a competitive market where new entrants or existing competitors compete away any supernormal profits, what could be a possible reason for the significant slowdown in earnings growth after the initial expansion?
- Decrease in market competition.
- Market saturation, increased competition, or changes in market conditions.
- Decrease in the number of new entrants in the market.
Answer: Choice B is correct.
Market saturation, increased competition, or changes in market conditions are the most likely reasons for a significant slowdown in earnings growth after an initial expansion. In a competitive market, companies often experience rapid earnings growth from a low base as they establish their market position and take advantage of opportunities. However, as the market becomes saturated, competition intensifies, or market conditions change, the rate of earnings growth can slow significantly. Market saturation occurs when a product or service has been maximized in its current market. There is little room for growth because most or all of the potential customers are already using the product or service. Increased competition can erode a company’s market share and put downward pressure on prices, reducing profit margins. Changes in market conditions, such as shifts in consumer preferences or technological advancements, can also impact a company’s earnings growth.
Choice A is incorrect. A decrease in market competition would not typically lead to a slowdown in earnings growth. In fact, less competition could potentially lead to increased earnings as a company could gain a larger market share and potentially increase prices without losing customers to competitors.
Choice C is incorrect. A decrease in the number of new entrants in the market would not typically lead to a slowdown in earnings growth. Fewer new entrants would mean less competition, which could potentially lead to increased earnings. However, this would depend on other market conditions and the competitive strategies of existing firms.
Question 2: In the realm of quantitative investing, after the data has been collected and managed, the investor creates quantitative models. These models are mathematical representations of the investor’s hypothesis and are used to predict potential investment returns. The investor must be comfortable with the investment value predicted by their models before proceeding. What is the primary purpose of these quantitative models in the investment process?
- To provide a visual representation of the investor’s hypothesis.
- To predict potential investment returns.
- To collect and manage data.
Answer: Choice B is correct.
The primary purpose of quantitative models in the investment process is to predict potential investment returns. These models are mathematical representations of the investor’s hypothesis and are used to test the hypothesis against historical data. The models use a variety of inputs, including historical data, economic indicators, and market data, to generate predictions about future investment returns. These predictions are then used to guide investment decisions. The investor must be comfortable with the investment value predicted by their models before proceeding. This is because the models are used to guide investment decisions, and if the investor is not comfortable with the predicted returns, they may choose not to invest. Therefore, the primary purpose of these models is to predict potential investment returns, not just to provide a visual representation of the investor’s hypothesis or to collect and manage data.
Choice A is incorrect. While quantitative models can provide a visual representation of the investor’s hypothesis, this is not their primary purpose. The main goal of these models is to predict potential investment returns, not just to visualize the hypothesis. Visualizing the hypothesis can be a useful tool in understanding the model, but it is not the main goal of the model.
Choice C is incorrect. Collecting and managing data is an important part of the investment process, but it is not the primary purpose of quantitative models. The models use the collected and managed data as inputs, but their main purpose is to predict potential investment returns. The data collection and management process is a separate step in the investment process, which is done before the creation of the models.
Portfolio Management Pathway Volume 1: Learning Module 2: Active Equity Investing: Strategies; LOS 2(j): Describe how quantitative active investment strategies are created
Offered by AnalystPrep


Get Ahead on Your Study Prep This Cyber Monday! Save 35% on all CFA® and FRM® Unlimited Packages. Use code CYBERMONDAY at checkout. Offer ends Dec 1st.