


Protective Put position
Introduction to and Objectives of the Protective Put A protective put strategy combines... Read More

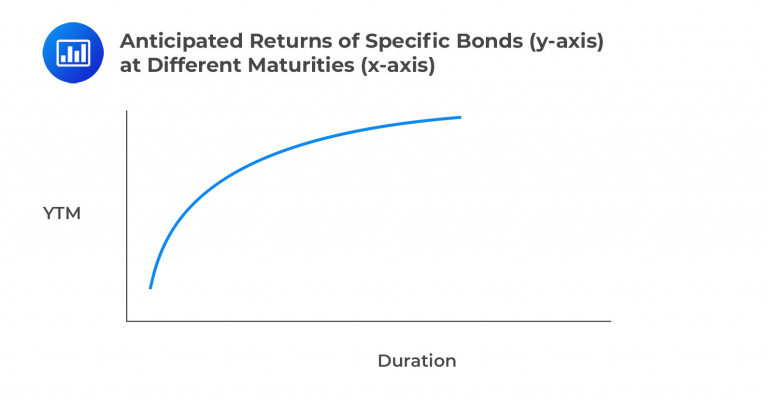
The yield curve visually represents of bonds with similar credit quality but varying maturities. This graphical depiction illustrates the anticipated returns of specific bonds (y-axis) at different maturities (x-axis).
The return components of bond portfolios aiming to capitalize on yield curve shifts encompass the following categories:
Yield Income: This component involves the return derived from collecting coupon payments as they become due.
$$ \text{Yield Income} = \frac { \text{Annual Coupon Payment}}{\text{Current Bond Price}} $$
Rolldown Return: This return arises from renewing bonds within the portfolio as they mature, akin to a price change based on expectations.
$$ \text{Rolldown Return} = \frac { (\text{End Price} – \text{Begin Price}) }{ \text{Begin Price}} $$
$$ \text{Rolling Yield} = \text{Yield Income} + \text{Rolldown Return} $$
Price change due to changing benchmark yields.
Price change due to changing yield spreads.
Price change due to changing currency values.
The yield curve, a representation of bond yields at varying maturities, involves complexities in its construction due to the following challenges:
These factors collectively hinder the creation of a flawless yield curve. It’s important to note that yield curves aren’t directly observed market data but theoretical constructs crafted by analysts using available market information.
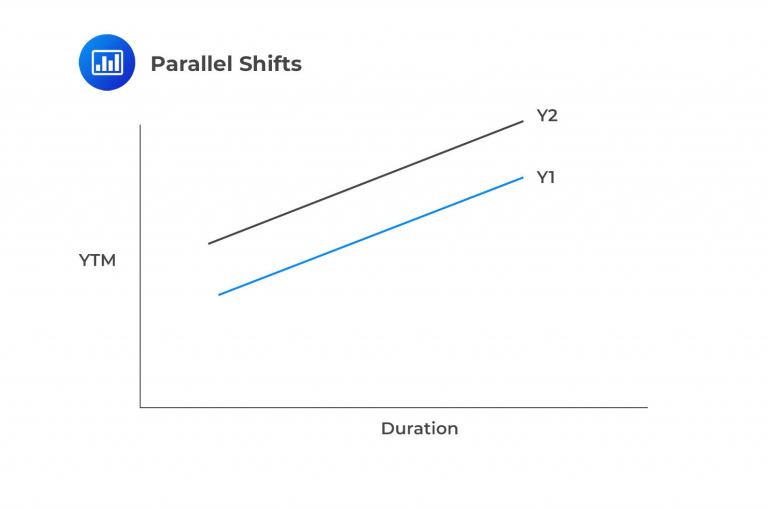
Parallel shifts: Involve an equal change in yields across the maturity spectrum.
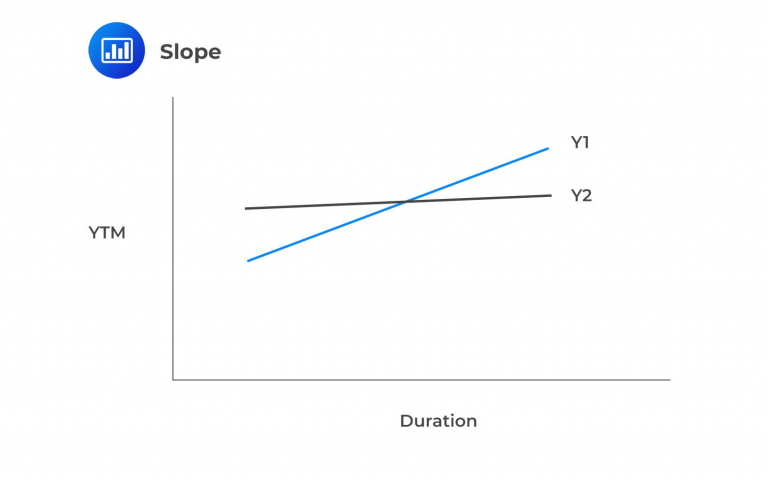
Slope: Involves changing yields only for a particular portion of the maturity spectrum.
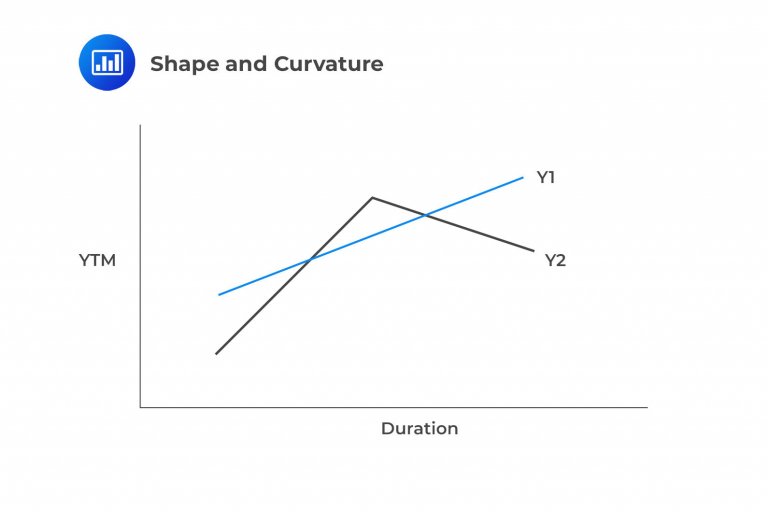
Shape and Curvature: Often referred to as ‘twists,’ these involve yield alterations at two specific points. For simplicity, consider a scenario where short-term and long-term rates experience changes in opposite directions while medium-term rates move differently.
The butterfly spread is often used to measure these types of changes in the yield curve:
$$ \textbf{Butterfly spread} = – (\text{ST Yields}) + (2 \times \text{Medium-term Yields}) – (\text{LT Yields}) $$
While duration shows a linear relationship between time and yield, convexity is a second-order effect demonstrating a curvature in the relationship (note that the initial graphic in this learning objective shows a curved line, thus demonstrating convexity).
Remember the formula for convexity is:
$$ C = MD^2 + MD + \frac {\text{Dispersion} }{ (1+ \text{Periodic Rate})^2} $$
Where:
\(C\) = Convexity.
\(MD\) = Macaulay duration.
Hence, upon examining the formula, it becomes evident that portfolio convexity directly correlates with the numerator’s dispersion measure.
Convexity holds allure for bonds, yet it isn’t without a cost. Bonds exhibiting higher convexity experience relatively lesser value reduction when yields increase and greater value appreciation when yields decrease. This characteristic often corresponds with a lower yield-to-maturity and is influenced by the dispersion of cash flows – essentially, how cash flows are distributed over time.
While handling parallel shifts is relatively straightforward, addressing yield curve shifts that deviate from parallel requires a more sophisticated approach to interest rate management. Managers need to identify key hanging curve points and assess the extent of those changes to optimize returns.
Here are strategies for such scenarios:
A practical method to implement these strategies involves choosing between laddered, bullet, and barbell portfolios:
When portfolio managers introduce convexity, it comes at a cost, often resulting in a lower yield. The effectiveness of this strategy depends on the realized volatility compared to the expected volatility during the implementation of convexity. If managers anticipate a stable market environment, they might sell convexity. Below are several standard methods that managers employ to modify convexity impact.
One method of adjusting portfolio convexity without altering portfolio duration involves choosing from the laddering, barbell, and bullet portfolio strategies mentioned earlier.
$$ \begin{array}{c|c|c} \textbf{Structure} & \textbf{Convexity} & \textbf{Intuition} \\ \hline \text{Bullet} & \text{Lowest} & \text{No dispersion of future cash flow(s)} \\ \hline \text{Barbell} & \text{Middle} & \text{Two points of cash flow timing} \\ \hline \text{Ladder} & \text{Highest} & \text{Largest dispersion of future cash flow timing} \end{array} $$
Question
Which of the following statements regarding yield curve risks is least likely to be true?
- Parallel shifts involve an unequal change in yields across the maturity spectrum.
- Slope involves changing yields only for a particular portion of the maturity spectrum.
- Shape and Curvature, also described as ‘twists’, combine changing yields at two given points.
Solution
The correct answer is A.
Parallel shifts involve an equal change across the maturity spectrum. Candidates should picture a parallel shift as a yield curve that maintains its exact shape and slope but merely moves up or down to new yield ranges at the same duration. See below:
Both B and C are more likely to be true. Slope involves changing yields for a particular portion of the maturity spectrum, such as short-term or long-term bonds. Shape and Curvature, also known as twists, combine changing yields at two given points, such as the short and long ends of the curve. These changes can result in a flattening or steepening of the yield curve, which can affect the prices and returns of fixed-income securities.
Reading 21: Yield Curve Strategies
Los 21 (a) Describe the factors affecting fixed-income portfolio returns due to a change in benchmark yields
Practice CFA Level III fixed-income concepts including yield curve dynamics, rolldown return, rolling yield, duration, convexity, and non-parallel yield curve strategies with AnalystPrep’s study resources.
Offered by AnalystPrep


Get Ahead on Your Study Prep This Cyber Monday! Save 35% on all CFA® and FRM® Unlimited Packages. Use code CYBERMONDAY at checkout. Offer ends Dec 1st.