


Controlled Interest Rate Risks For Fut ...
Investment managers and investors utilize swaps, forwards, futures, and volatility derivatives in various... Read More

Securities analysts can use two main approaches for selecting investments: top-down and bottom-up. The top-down method starts with macro factors, like GDP, to influence investment choices based on expectations. While it considers major forces, it’s a disadvantage because many analysts consider these factors, reducing potential outperformance.
Top-down managers often use public ratings to categorize bonds by credit quality. Different agencies have varying rating schemes, such as AAA, for high credit quality. Remembering exact schemes isn’t crucial.
In contrast, bottom-up approaches focus on individual securities. Similar securities are compared for relative advantages. This can uncover pricing inefficiencies and lead to outperformance.
In the bottom-up, the approaches below apply:
Analysts might adjust a benchmark’s weights or create their weighting scheme.
Altman’s 1968 Z-score is a metric that combines various financial factors, including liquidity \( \left(\frac {\text{working capital}}{\text{total assets}} \right)\), profitability \(\left(\frac {\text{retained earnings}}{\text{total assets}} \right)\), asset efficiency \(\left( \frac {\text{EBIT}}{\text{total assets}} \right)\), the relationship between market and book value of equity, and asset turnover \(\left( \frac {\text{sales}}{\text{total assets}} \right)\).
Coefficients weight these factors to create a composite score, known as the Z-score. The Z-score is then used to categorize manufacturing companies into two groups: those expected to remain financially sound and those at risk of bankruptcy. Similar to credit scoring models, this method of multiple discriminant analysis condenses multiple input variables into a single Z-score cutoff representing the default threshold.
Z-score model Calculation
$$ 1.2 \times A + 1.4 \times B + 3.3 \times C + 0.6 \times D + 0.999 \times E $$
Where:
\(A= \frac {\text{Working capital}}{\text{Total assets}}\)
\(B= \frac {\text{Retained earnings}}{\text{Total assets}}\)
\(C= \frac {\text{EBIT}}{\text{Total assets}}.\)
\(D= \frac {\text{Market value of equity}}{\text{Total liabilities}}\)
\(E= \frac {\text{Sales}}{\text{Total assets}} \)
Note:
\(Z-\text{score} \gt 3\)= Indicates a solid financial position.
\(1.8 \lt Z-\text{score} \gt 3\)= Indicates risk of financial distress.
\(Z-\text{score}\lt 1.8\)= Indicates the likelihood of insolvency
The top-down approach begins by looking at macro factors which affect bond values E.g., GDP may be a starting point: Based on the analyst’s expectations for GDP, the manager will begin to select investments which may benefit from their views.
The model for excess return is again instructive in the quest to uncover pricing inefficiencies. The following model can help guide the analyst’s thinking in the selection process. For example, is the spread expected to grow, shrink, or stay the same? If it stays the same, analysts will focus their attention on the default portion of the equation, hoping to uncover bonds that are less likely to default than the market expects.
$$ \begin{align*} \text{Estimated Excess Return} & = (\text{Spread} \times T) – (\Delta \text{Spread} \times \text{Spread }D) \\ & – (T \times P \times L) \end{align*} $$
Where:
\(\Delta \text{Spread}\) = Change in spread.
\(\text{Spread } D\) = Spread duration.
\(T\) = Relevant period.
\(P\) = Probability of default.
\(L\) = Loss given default.
Spread curves demonstrate various issues of two different firms. A line of best fits ties together all of the issues of ABC company. The solid line in the graphic below represents this. Each individual’ x’ represents a bond. DEF Company is represented by the blue line, with the blue dots representing each bond. A spread curve could be helpful for either comparing two firms or comparing an individual bond vs. its cohort.
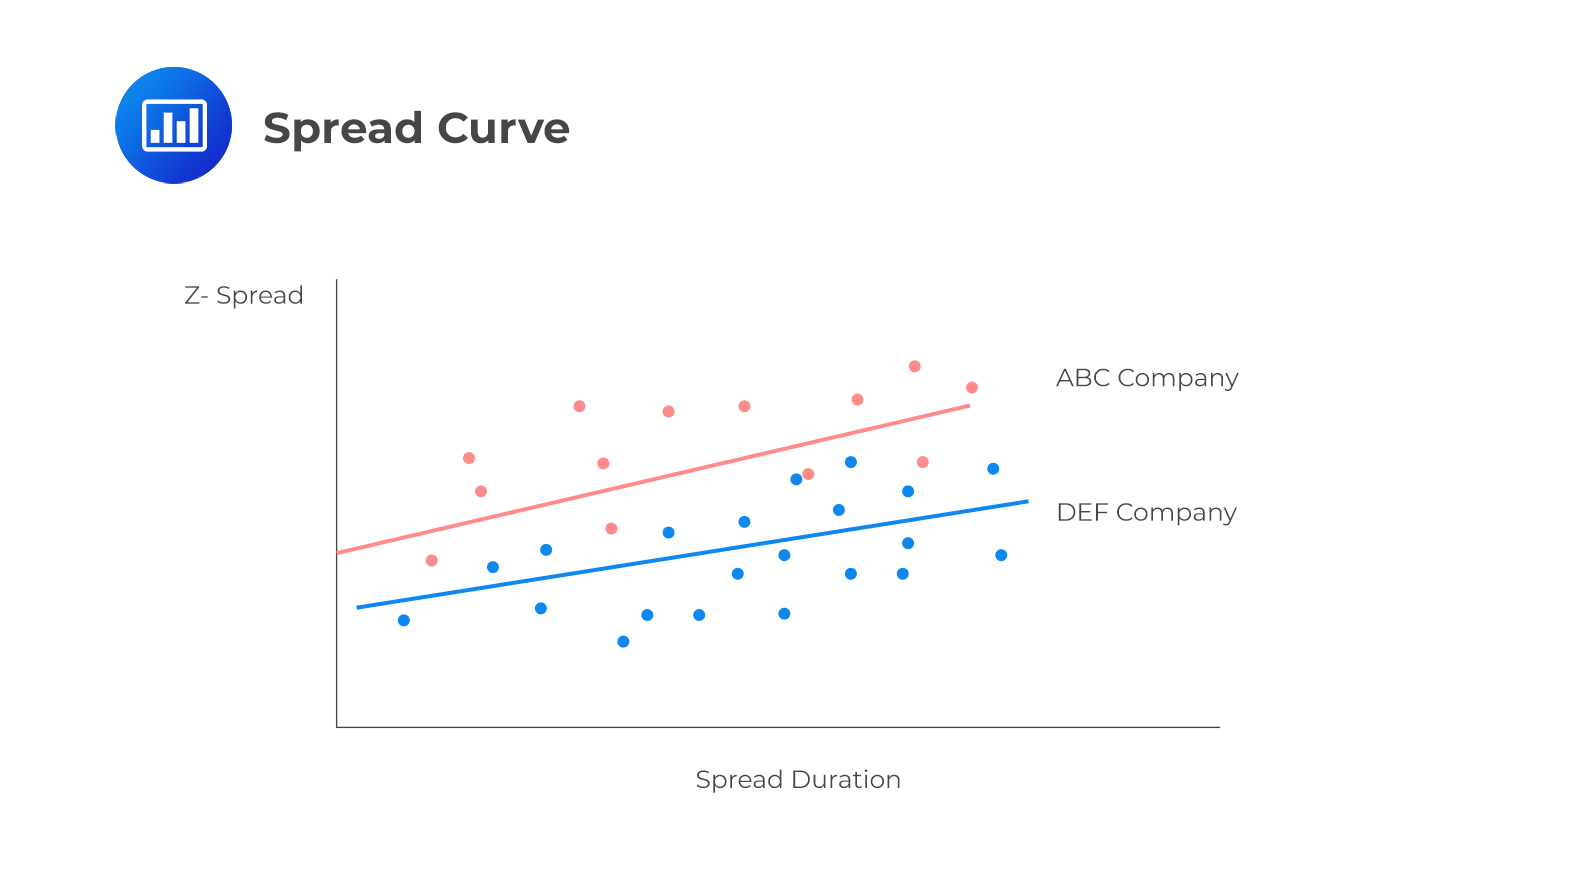 For example, there are a few issues from ABC Company that plot above the curve. These issues offer a higher spread than is typical for bonds of that firm. This could represent an opportunity to uncover hidden value if the manager believes default on these securities is no more likely than average.
Looking at the two firms in comparison, ABC offers a higher spread. This means that ABC offers a higher yield. It also means their bond prices will increase if the spread narrows and ABC’s yields decrease. The opposite would be valid were spreads to widen.
In real-world scenarios, portfolio managers might face limitations that restrict their choices. Environmental, Social, and Governance (ESG) considerations could exclude companies with carbon emissions, unhealthy food production, or unethical labor practices from the portfolio, even if it affects portfolio performance, as ESG factors gain prominence.
Adding to the complexity, bond markets, especially bond credit markets, can lack liquidity. This means managers might not secure their ideal bond based on analysis. In return, this necessitates alternative actions such as selecting from a list of identified bonds and utilizing ETFs or derivatives for exposure until the desired bond becomes available again.
Credit spreads are influenced by fundamental factors outlined in a framework by Israel, Palhares, and Richardson (2018):
Active credit investors typically integrate ESG factors into their portfolio strategies using one of three fundamental approaches:
ESG-specific ratings for private and public issuers significantly affect portfolio selection. These ratings use diverse quantitative and qualitative criteria to assess ESG attributes. Due to variations in methodologies and weightings, there can be substantial differences between ESG ratings and credit ratings.
However, there is a tendency for ESG and credit ratings to be positively correlated for two primary reasons. First, financially robust issuers are often better positioned to meet stringent ESG standards, while those at a higher risk of financial trouble may face governance and other adverse ESG risks. Second, major rating agencies now explicitly integrate ESG risks into their conventional credit rating procedures, as demonstrated by Moody’s in 2019, where ESG risks were cited as a material factor in a significant portion of credit rating actions for private sector issuers.
Green bonds are fixed-income instruments designed to fund ESG-related projects, particularly those focused on environmental and climate benefits. This rapidly expanding sector encompasses corporate, financial institution, and public issuers channeling bond proceeds into initiatives like pollution reduction, recycling, environmental remediation, and sustainable construction materials. Issuers often adhere to voluntary guidelines such as the International Capital Market Association’s Green Bond Principles (2018) to ensure compliance with investor ESG criteria.
While green bonds typically share the same senior unsecured ranking as the issuer’s other bonds and exhibit similar pricing, their favorable ESG attributes often generate heightened investor interest compared to conventional debt issues.
Question
An analyst uses a bottom-up approach and has identified two firms in the industrials industry, which she believes may represent an opportunity for alpha. Based on the data below, which of the following portfolios would the analyst most likely choose?
$$ \begin{array}{l|ccc} & & \textbf{Bond} & \textbf{Yields} \\ \hline & \textbf{6 months} & \textbf{2 year} & \textbf{5 year} \\ \hline \textbf{Clorona Chemicals} & 1.40\% & 1.80\% & 1.85\% \\ \hline \textbf{BioAvailable, Inc.} & 1.90\% & 2.10\% & 3.25\% \end{array} $$
$$ \begin{array}{lll} & \text{Spread outlook} & \textit{widening} \\ A. & \text{Short BioAvailable;} & \text{Long Clorona Chemicals. } \\ B. & \text{Long Clorona Chemicals;} & \text{Short BioAvailable.} \\ C. & \text{Long Clorona Chemicals Only.} & \end{array} $$
Solution
The correct answer is A.
It aligns with the expected widening of spreads by shorting BioAvailable (higher yield) and going long on Clorona Chemicals (lower yield). This strategy aims to benefit from the anticipated increase in credit risk or market uncertainty.
B and C are incorrect. Both options do not fully align with the expected spread outlook of widening, making them less likely choices given the information provided. However, the final decision would depend on the analyst’s assessment of the risks and opportunities associated with these two companies and their bonds.
Reading 22: Fixed Income Active Management: Credit Strategies
Los 22 (d) Discuss top-down approaches to credit strategies
Offered by AnalystPrep


Get Ahead on Your Study Prep This Cyber Monday! Save 35% on all CFA® and FRM® Unlimited Packages. Use code CYBERMONDAY at checkout. Offer ends Dec 1st.