Currency Management for Emerging Marke ...
Managing emerging market currency risk presents a unique set of challenges, with two... Read More
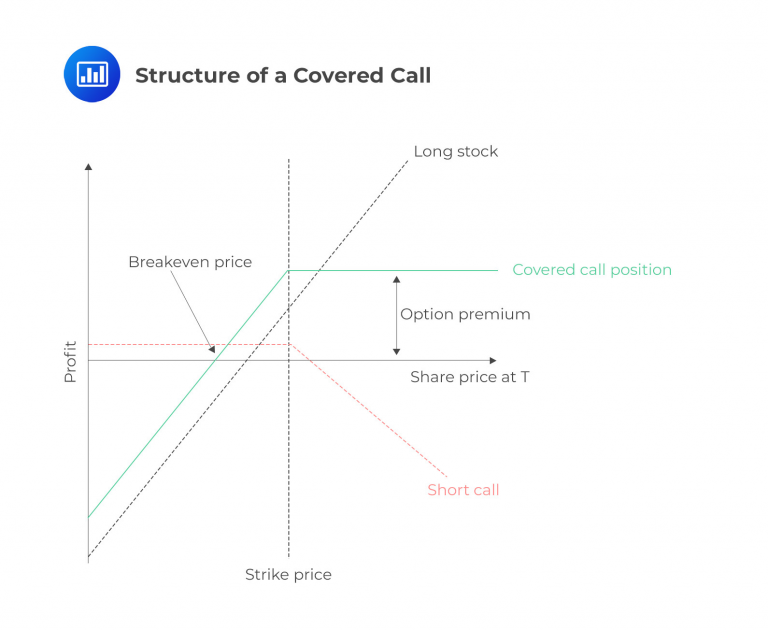
A covered call strategy has two components: long and short stock positions. The term “covered” signifies that the short call is backed or “covered” by the underlying stock an investor holds. If the short call option is exercised, the position is covered because the investor already owns the stock and can fulfill the call obligation by selling the stock.
The covered call strategy is generally considered bullish to mildly bullish. This classification depends on the gap between the stock’s current market price and the short call option’s strike price. The covered call strategy carries less risk than the long stock position alone. This is because selling the call option generates income as a premium cushion against potential downside movements in the stock price.
Investors use covered calls for various purposes. They can generate additional income through the premium from selling the call option, benefit from earning dividends on the underlying stock, and potentially realize capital gains during the strategy.
Covered calls consist of a long stock position and a short one on that same stock. The call will generally be slightly out of the money, but this is not a hard and fast rule. A covered call can be represented in the figure below.

Let’s consider an example to illustrate the concept. Assume that an investor owns 100 shares of BilBo Bakery Company (ticker: BBC), which is currently trading at $98.00 per share. The investor sells a call option against this stock to generate additional income. Anticipating that the stock will pay a dividend and not rise significantly above its current price, the investor sells a call option with a strike price of $105.00, expiring in one month. It is important to note that the strike price is above the current market price, making the call option “out of the money.” In this case, the investor receives a premium of $3.00 for selling the call option. In the following section, we will explore the potential outcomes of this position at expiration under different scenarios.
Now, let’s examine the potential results of the BBC-covered call example by considering different stock prices at expiration. We can calculate the total value of the position at expiration, which includes both the stock and the call option, using the following formula:
$$ \text{Value of stock} – \text{value of call} = \text{Total Position Value} $$
$$ \text{Value of a call} = \text{Max} (0, \text{Stock} – \text{Strike}) $$
$$ \begin{array}{c|c|c|c} \textbf{Stock price} & \textbf{Value of Call} & \textbf{Value of} & \textbf{Value of} \\ \textbf{@ Expiry} & & \textbf{Stock} & \textbf{Position} \\ \hline \$85 & \text{Max}(0, 85-105) = 0 & \$85 & \$85 – 0 = \$85 \\ \hline \$90 & \text{Max}(0, 90-105) = 0 & \$90 & \$90 – 0 = \$90 \\ \hline \$95 & \text{Max}(0, 95-105) = 0 & \$95 & \$95 – 0 = \$95 \\ \hline \$100 & \text{Max}(0, 100-105) = 0 & $100 & \$100 – 0 = \$100 \\ \hline \$105 & \text{Max}(0, 105-105) = 0 & $105 & \$105 – 0 = \$105 \\ \hline \$110 & \text{Max}(0, 110-105) = \$5 & $110 & \$110 – \$5 = \$105 \\ \hline \$115 & \text{Max}(0, 115-105) = \$10 & $115 & \$115 – \$10 = \$105 \end{array} $$
In this example, the covered call position imposes a maximum value limit of $105 on the position, which is the tradeoff for receiving the premium income. However, the premium income has not been included in the previous table. Let’ consider that the investor earned a premium of $3.00. To provide a more precise representation, we can add $3.00 to the position’s value at expiration in a second step. This will result in the following payoff diagram:
$$ \begin{array}{c|c|c} \textbf{Stock price} & \textbf{Total Value of} & \textbf{Position Value +} \\ \textbf{@ Expiry} & \textbf{Position} & \textbf{Premium} \\ \hline \$85 & \$85 – 0 = \$85 & \$88 \\ \hline \$90 & \$90 – 0 = \$90 & \$93 \\ \hline \$95 & \$95 – 0 = \$95 & \$98 \\ \hline \$100 & \$100 – 0 = \$100 & \$103 \\ \hline \$105 & \$105 – 0 = \$105 & \$108 \\ \hline \$110 & \$110 – \$5 = \$105 & \$108 \\ \hline \$115 & \$115 – \$10 = \$105 & \$108 \end{array} $$
The chart clearly illustrates that investors who employ a covered call strategy will achieve their maximum profit at lower stock prices. However, in exchange for this benefit, they limit their potential for unlimited upside gains on the position.
Despite the numerous advantages of a covered call strategy, certain drawbacks exist. These include:
It is important to note that the covered call strategy generates quicker profits and income. At the same time, the overall risk remains similar to that of holding the stock alone.
Investors may arrive at the breakeven of a covered call with the following formula:
$$ \text{Breakeven at expiration} = (\text{Price paid for stock} – \text{premium earned}) $$
In the earlier example, an investor purchased BBC stock for $98.00 and sold a covered call for $3.00. As a result, the effective price of the stock acquisition is reduced to $95.00. This breakeven price represents the point at which the position neither gains nor loses value.
Value at expiration
$$ \begin{align*} \text{Value at expiration } (V_T) & = \text{Value at expiration} \\ & = \text{Stock price} – \text{Exercise value of the call} \end{align*} $$
$$ V_T= S_T – \text{Max}[(S_T – K),0] $$
Profit
$$ \begin{align*} \text{Profit} & = \text{Value at expiration} + \text{Option premium received} – \text{Initial stock price} \\ \text{Profit} & = V_T+ c_0 – S_0 \end{align*} $$
Maximum profit
Maximum profit occurs at and above the strike price
$$ \text{Maximum profit} = K-S_0+c_0 $$
Maximum loss
$$ \text{Maximum loss} = S_0-c_0 $$
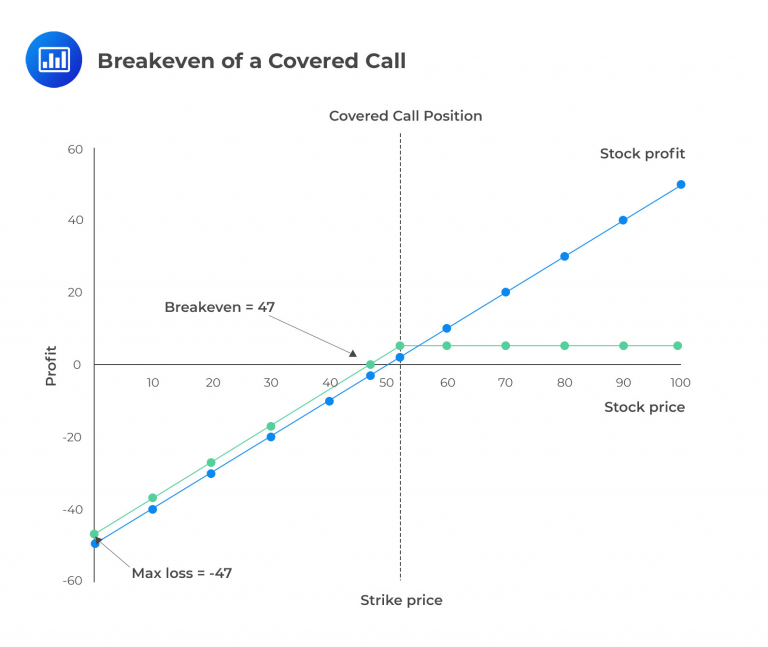
Consider an investor who buys a stock for $50 and sells a call for $3 with a strike price of $52. At the expiration date of the call:
Parameters
\(K\)=$52
\(S_0\)=50
\(c_0\)=$3
Maximum profit
$$ \text{Maximum profit} =(\$52-\$50)+\$3=\$5 $$
Maximum loss
$$ \text{Maximum loss} = \$50 – \$3=\$47 $$
Breakeven price
$$ \text{Breakeven price} = \$50- \$3=\$47 $$
Profit calculated over different stock prices;
$$ \text{Profit} = S_T – \text{Max}[(S_T – K),0] + c_0 – S_0 $$
Profit at $0:
$$ \text{Profit} =\$0 – \text{Max}[(0 – \$52),0]+\$3 -\$50=-\$47,\text{loss of } $47 $$
Equivalent to the maximum loss
Profit at $50:
$$ \text{Profit} =\$50- \text{Max}[(50 – \$52),0]+\$3 – \$50=\$3 $$
Profit at $52:
$$ \text{Profit} =\$52- \text{Max}[(52 – \$52),0]+\$3 – \$50=\$5 $$
Equivalent to the maximum profit.
The following diagram represents the above-covered call.

Question
Which equity market sentiments would most likely benefit a covered call strategy?
- Decidedly Bullish.
- Mildly Bearish.
- Firmly Neutral.
Solution
The correct answer is C.
The ideal scenario for covered call writers is a neutral to slightly bullish market outlook. This strategy enables investors to generate income while they anticipate potential capital gains. The income can come from dividends and call premiums, and there is also the possibility of a capital gain if the call option was written with a strike price above the current market price (out of the money).
A is incorrect. A truly bullish investor should buy the shares alone (or buy a call alone).
B is incorrect. A bearish investor should short the shares alone (or buy a put alone).
Derivatives and Risk Management: Learning Module 1: Options Strategies; Los 1(b) Discuss the investment objective(s), structure, payoff, risk(s), value at expiration, profit, maximum profit, maximum loss, and breakeven underlying price at expiration of a covered call position
Get Ahead on Your Study Prep This Cyber Monday! Save 35% on all CFA® and FRM® Unlimited Packages. Use code CYBERMONDAY at checkout. Offer ends Dec 1st.