


Credit Management
Active Credit Management and Structured Financial Instruments Active credit managers in the financial... Read More

Public markets include listed equity and debt securities from mature issuers with stable cash flows. For instance, companies like Apple and Microsoft are part of the public market.
Large public equity issuers usually pay periodic dividends to shareholders, while public debt securities are typically non-callable bonds that pay periodic fixed coupons to debtholders. For example, Coca-Cola is known for its regular dividend payments.
Public security analysts rely on measures of income and asset appreciation calculated on a consistent periodic basis to compare returns and performance. This is similar to how analysts would compare the performance of Amazon and Google based on their quarterly earnings reports.
Private market investments include private equity and debt from various stages over the company life cycle, as well as private real estate and infrastructure. Examples include investments in startups or private real estate projects.
These investments face valuation challenges due to their illiquidity, lack of price transparency, and dissimilarity among investments in the same private asset class. For instance, valuing a startup can be challenging due to the lack of a public market price.
These factors prevent analysts from applying the same periodic and relative performance measures as for public markets.
Private market investments also involve extended upfront capital commitments, which do not exist in public markets. For example, an investor might commit funds to a startup years before the company begins generating revenue.
Investors must typically commit funds to a limited partnership months or years in advance of capital deployment, with little certainty regarding the timing or magnitude of capital calls. This is similar to how venture capitalists commit funds to startups.
Investors often hold these commitments in more liquid public investments with possibly lower expected returns. For example, an investor might hold funds in a low-risk bond while waiting for a capital call from a private investment.
Return on Investment (ROI) is a common performance measure in private markets. It is the ratio or multiple of cash flows received versus those invested. For example, if an investor puts $100,000 into a startup and later sells their stake for $200,000, their ROI would be 2.0.
ROI ignores the time value of money and the investment holding period. This means that it doesn’t account for the fact that money today is worth more than the same amount in the future due to its potential earning capacity.
In the special case where a single investment occurs at the beginning of an investment holding period and a one-time payoff occurs at the end, the ROI over an investment time horizon can be converted to an equivalent Internal Rate of Return (IRR) of an n-year investment holding period. The IRR is the discount rate that makes the net present value of all cash flows (both positive and negative) from a particular project equal to zero.
$$ROI=\frac{\sum(\text{Cash flows received})}{\sum(\text{Cash flows invested})}$$
Where:
$$ROI = (1 + IRR)^n$$
where n = Number of years of the investment holding period
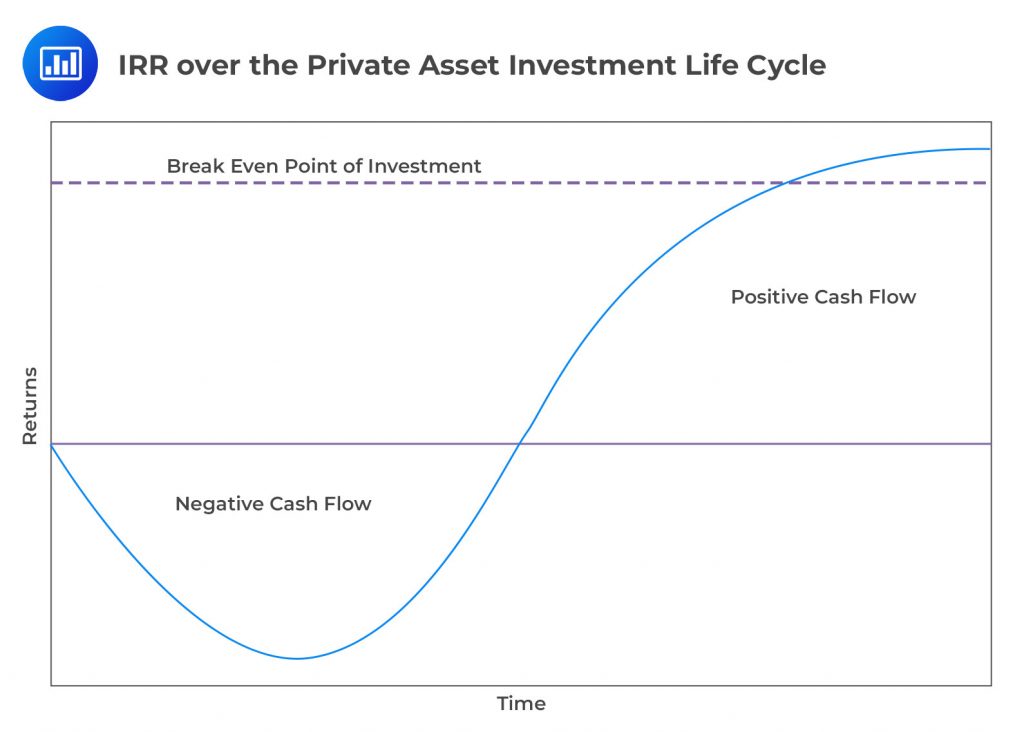
The Internal Rate of Return (IRR) is a financial metric used to evaluate the profitability of potential investments. It is the discount rate that makes the net present value (NPV) of all cash flows (both positive and negative) from a particular project or investment equal to zero. In simpler terms, IRR is the annualized effective compounded return rate that can be earned on the invested capital, i.e., the yield on the investment. Consider the figure below, the portion of the curve that is below the horizontal zero line represents times when the investment is losing money or when money is being spent (negative cash flows). The portion of the curve above the horizontal zero line represents times when the investment is making money (positive cash flows). The dashed line across the graph at the “zero” level on the Returns axis represents the break-even point for the investment. When the curve is below this line, you’re in a loss position; when it’s above, you’re in a profit position. To understand IRR, it’s important to first grasp the concept of Net Present Value (NPV), which is the sum of the present values of the cash flows at a given discount rate. The formula for NPV is: $$NPV = \sum \left( \frac{CF_t}{(1 + r)^t} \right) – \text{Initial Investment}$$
Where:
The IRR is the rate \(r\) that sets the NPV to zero: $$0 = \sum \left( \frac{CF_t}{(1 + IRR)^t} \right) – \text{Initial Investment}$$ The concept of IRR is key because it accounts for the timing of each cash flow. The earlier you receive cash (or the later you have to pay it out), the more valuable it is due to the time value of money. This is why the IRR is a preferred metric for comparing the efficiency of different investments. It can be thought of as the annual growth rate that an investment achieves over its lifecycle.
After a three-year expansion phase, assume that PeakInvest Capital can sell its initial USD250 million (equal to 25% of the original USD1 billion investment) equity stake in OptiGrow Ventures for USD800 million.
If we assume that PeakInvest makes a single initial investment and receives no dividends or distributions over the three years prior to the sale, calculate the ROI on the OptiGrow equity position.
The ROI is calculated using the formula:
$$ROI = \frac{\sum (\text{Cash flows received})}{\sum (\text{Cash flows invested})}$$
Substituting the given values:
$$ROI = \frac{\text{USD 800 million}}{\text{USD 250 million}} = 3.2$$
The calculated ROI of 3.2 indicates that PeakInvest Capital’s investment in OptiGrow Ventures yielded a return three times greater than the initial investment. This ratio signifies a substantial return on the initial investment, highlighting the investment’s success over the three-year period. ROI is a straightforward and powerful tool for evaluating the efficiency of an investment, comparing the magnitude of the investment’s gains to its cost. In this scenario, an ROI of 3.2 suggests that for every dollar PeakInvest invested in OptiGrow Ventures, it earned $3.20 in return. This analysis does not consider the time value of money, which is a limitation of the ROI metric. However, it provides a quick and easy-to-understand measure of investment performance.
PeakInvest Capital has set a target return of 25% over a three-year holding horizon for its venture capital portfolio. Analyze if the sale of PeakInvest’s initial USD 250 million equity stake in OptiGrow Ventures for USD 800 million after three years meets the target return of 25% over the holding period. Additionally, explore how the investment return would differ if the same sale amount was realized and the proceeds were distributed before the completion of the three-year horizon.
The IRR is the rate \(r\) that sets the Net Present Value (NPV) of all cash flows to zero, given by the formula:
$$0 = – \text{Initial Investment} + \frac{\text{Cash flow at end of period}}{(1 + IRR)^n}$$
Where:
Substituting the given values into the IRR formula:
$$0 = -250 + \frac{800}{(1 + IRR)^3}$$
By solving this equation, the IRR for PeakInvest Capital’s investment in OptiGrow Ventures over the three-year period is found to be approximately 47.36%.
The IRR of 47.36% significantly exceeds PeakInvest Capital’s target return of 25% over three years, indicating a highly successful investment. This outcome demonstrates the efficiency and profitability of the investment, providing substantial returns above the set expectations. If the investment were realized for the same amount but the proceeds were distributed before the completion of the three-year period, the IRR would indicate an even higher return rate. This scenario emphasizes the importance of the investment duration on its profitability, illustrating how earlier returns contribute to an increased perceived investment efficiency.
Private market funds experience phases of cash outflows and inflows, with initial investments often leading to negative cash flows. These are anticipated to be balanced by later inflows from the sale of investments, aiming for a positive return over the fund’s life.
Due to the uneven timing of cash flows, benchmarking the Internal Rate of Returns (IRRs) of private market funds against public market returns poses challenges. Public Market Equivalent (PME) methodologies serve to compare these distinct return profiles by simulating private fund cash flows within a public market context.
The PME approach translates private fund cash flows into a public market investment scenario, using a public market index to mirror private cash outflows and inflows. The terminal value of this hypothetical investment is used to calculate the PME IRR, offering a basis for comparison with public market returns.
PME methodologies have evolved to address issues such as the appropriate choice of the public market index, which should closely match the characteristics of the private fund’s investment focus. Factors like company size, value vs. growth orientation, and leverage are considered in selecting a suitable index.
Overall fund returns are estimated based on net cash flows over the fund’s life, incorporating the varied durations of investment selection, capital deployment, return distribution, and exit processes. GPs provide several return multiples to LPs to quantify and compare performance, considering the diversity in capital deployment and returns over time and across investments.
While overall fund performance is assessed through fund-level cash flows, individual investments within the fund are evaluated based on their project IRRs, which may only involve initial investments and exit values. Differences in investment types, such as venture capital or infrastructure investments, highlight the varied approaches to calculating shareholder returns.
Private Market Fund Multiples are used by General Partners (GPs) to communicate performance to Limited Partners (LPs). These multiples offer more detail than the simple return on investment measure over the entire investment life cycle. Despite ignoring the time value of money and the investment holding period, these multiples are popular due to their ease of calculation and ability to differentiate between realized proceeds and the unrealized portfolio, as well as different types of return.
The first of these multiples is the Paid-In Capital (PIC), which addresses the proportion of total capital committed that has been deployed to date. PIC measures the degree to which the drawdown phase of the investment life cycle is complete. This allows LPs to compare similar investments across both GPs and vintage years, as well as across private asset classes. PIC is also used as an indicator of when the GP may return to the market to raise a new fund. For instance, GPs may raise a new fund when PIC reaches 75%.
The remaining multiples evaluate investor returns in the form of realized distributions and the net asset value, or unrealized value of investment, as compared to capital invested. The Distribution to Paid-In (DPI) multiple indicates an investor’s realized return on investment, often called the cash-on-cash return. It is calculated as the ratio of cumulative distributions to total capital invested and is calculated using $$DPI = \frac{\text{Cumulative distributions}}{\text{Total capital invested}}$$
Residual Value to Paid-In (RVPI) is the fund’s net asset value (NAV) as a proportion of the total invested capital. Since the NAV reflects the value of the fund’s remaining portfolio, this ratio is a measure of the investor’s unrealized return on investment and can be calculated as $$RVPI = \frac{\text{Net asset value}}{\text{Total capital invested}}$$
The Total Value to Paid-In (TVPI) multiple incorporates both the cumulative distributions received and the NAV as a proportion of invested capital. TVPI is the sum of DPI and RVPI. Average TVPIs of close to 3× are common in emerging, high-growth industries, such as information technology, and TVPIs near 2× are common in more mature industries, such as consumer goods. When considered gross of fees, the TVPI is sometimes referred to as the Multiple of Invested Capital (MOIC) or Multiple of Money (MOM).It can be calculate as $$TVPI = \frac{\text{Cumulative distributions + Net asset value}}{\text{Total capital invested}}$$ or $$TVPI = DPI + RVPI$$
BrightFutures Investment Fund IX, with capital commitments of USD 120 million, plans for capital deployment in three stages over four years: an initial USD 30 million, followed by USD 50 million and USD 40 million. The table below summarizes the fund’s Net Asset Value (NAV), capital called, and distributions to Limited Partners (LPs) over six years.
$$ \begin{array}{l|c|c|c|c|c|c|c} \textbf{Years} & \bf 0 & \bf 1 & \bf 2 & \bf 3 & \bf 4 & \bf 5 & \bf 6 \\ \hline \text{Net Asset Value} & & 70 & 115 & 150 & 180 & 210 & 250 \\ \hline \text{Capital Called} & -30 & -50 & -40 & & & & \\ \hline \text{Distributed Capital} & & & 10 & 20 & 50 & 75 & 100 \end{array} $$
To calculate PIC, we add up the capital called by the end of Year 2 and divide it by the total capital commitments to the fund:
$$ \begin{align*} \text{PIC} & =\frac {\text{Capital called by Year 2}}{\text{Total capital commitments}} \\ & = \frac { (\text{USD } 30 \text{ million} + \text{USD } 50 \text{ million} + \text{USD } 40 \text{ million}) }{ \text{USD } 120 \text{ million}} \\ & = \frac {\text{USD } 120 \text{ million} }{\text{USD } 120 \text{ million}} \\ & = 1.0 \text{ or } 100\% \end{align*} $$
The PIC for BrightFutures Investment Fund IX as of the end of Year 2 is 1.0, indicating that 100% of the committed capital has been deployed within the first two years of the fund’s lifecycle. This signifies that the drawdown phase for BrightFutures Investment Fund IX is complete as of the end of Year 2, potentially signaling the GP’s readiness to return to the market to raise a new fund.
The DPI is calculated using the formula:
$$ \begin{align*} \text{DPI} & = \frac { \text{Cumulative distributions by Year 6} }{ \text{Total capital called} } \\ & = \frac { \text{USD } 100 \text{ million} }{ \text{USD } 120 \text{ million} } \\ & = 0.83 \end{align*} $$
The DPI of 0.83 indicates that, as of the end of Year 6, investors have received distributions equivalent to 83% of the total capital they initially invested in BrightFutures Investment Fund IX. This metric signifies that investors are nearing a full return on their invested capital in terms of cash distributions, with 83 cents returned for every dollar invested, highlighting the fund’s capacity to generate cash returns for its investors.
The TVPI is calculated using the formula:
$$ \begin{align*} \text{TVPI} & =\frac { \text{Cumulative distributions by Year } 5 + \text{NAV at Year } 5) }{ \text{Total capital invested} } \\ & = \frac { (\text{USD } 75 \text{ million} + \text{USD } 210 \text{ million}) }{ \text{USD } 120 \text{ million}} \\ & = 2.375 \end{align*} $$
A TVPI of 2.375 as of the end of Year 5 indicates that investors in BrightFutures Investment Fund IX have seen a total value return of $2.375 for every dollar invested. This figure includes both the cash that has been distributed back to investors and the current valuation of the investment portfolio that remains in the fund. This high TVPI ratio underscores the fund’s successful investment strategy, offering significant realized and unrealized returns to its investors.
Questions
Question 1
A financial analyst is comparing the performance of different investments. She uses measures of income and asset appreciation calculated on a consistent periodic basis for public securities. However, she faces challenges when applying the same measures to private market investments. What is the primary reason for these challenges?
- Private market investments do not involve any risk.
- Private market investments always yield higher returns than public market investments.
- Private market investments face valuation challenges due to their illiquidity, lack of price transparency, and dissimilarity among investments in the same private asset class.
Answer C is correct.
The primary reason for the challenges faced by the financial analyst when applying the same measures to private market investments as she does to public securities is that private market investments face valuation challenges due to their illiquidity, lack of price transparency, and dissimilarity among investments in the same private asset class. Private market investments are not traded on public exchanges, which means they lack the liquidity and price transparency of public securities. This makes it difficult to determine their current market value. Furthermore, private market investments can vary greatly even within the same asset class, making it difficult to compare them directly. For example, two private equity investments in different companies may have very different risk and return profiles, even though they are both classified as private equity. This lack of comparability further complicates the task of measuring and comparing the performance of private market investments.
A is incorrect. Private market investments do involve risk. In fact, they often involve higher risk than public market investments due to their illiquidity, lack of price transparency, and the potential for greater variability in their performance.
B is incorrect. While private market investments can potentially yield higher returns than public market investments, this is not always the case. The performance of private market investments can vary greatly, and they can also result in significant losses. Therefore, it is not accurate to say that private market investments always yield higher returns than public market investments.
Question 2
The Residual Value to Paid-In (RVPI) multiple is another measure used to evaluate investor returns. It reflects the fund’s net asset value (NAV) as a proportion of the total invested capital. What does the RVPI multiple measure?
- The investor’s realized return on investment.
- The investor’s unrealized return on investment.
- The total value of the fund’s portfolio.
Answer B is correct.
The Residual Value to Paid-In (RVPI) multiple measures the investor’s unrealized return on investment. The RVPI multiple is calculated by dividing the net asset value (NAV) of the fund by the total capital invested in the fund. The NAV represents the current market value of the fund’s investments, while the total capital invested represents the amount of money that investors have put into the fund. The RVPI multiple, therefore, provides a measure of the unrealized return on investment, as it reflects the proportion of the fund’s NAV to the total capital invested. This measure is particularly useful for private equity funds, where investments are often illiquid and not regularly traded, making it difficult to realize returns. By providing a measure of the unrealized return, the RVPI multiple allows investors to assess the performance of their investment in the fund, even if they have not yet realized any returns.
A is incorrect. The investor’s realized return on investment is not measured by the RVPI multiple. The realized return on investment is the return that an investor has actually received from an investment, typically through the receipt of dividends or the sale of the investment. The RVPI multiple, on the other hand, measures the unrealized return on investment, which is the potential return that an investor could receive if they were to sell their investment at its current market value.
C is incorrect. The total value of the fund’s portfolio is not measured by the RVPI multiple. The total value of the fund’s portfolio is simply the sum of the market values of all the investments in the portfolio. The RVPI multiple, on the other hand, measures the proportion of the fund’s net asset value to the total capital invested in the fund, providing a measure of the unrealized return on investment.
Private Markets Pathway Volume 1: Learning Module 1: Private Investments and Structures; LOS 1(c): Discuss the difference between public and private market performance, and calculate, interpret, and discuss the use of performance metrics, including distributed to paid-in, residual value to paid-in, and total value to paid-in.
Offered by AnalystPrep


Get Ahead on Your Study Prep This Cyber Monday! Save 35% on all CFA® and FRM® Unlimited Packages. Use code CYBERMONDAY at checkout. Offer ends Dec 1st.