


Expected Value, Variance, Standard Dev ...
A portfolio is a collection of investments a company, mutual fund, or individual... Read More

A test statistic is a standardized value computed from sample information when testing hypotheses. It compares the given data with what an analyst would expect under the null hypothesis. As such, it is a major determinant when deciding whether to reject H0, the null hypothesis.
We use the test statistic to gauge the degree of agreement between sample data and the null hypothesis. Analysts use the following formula when calculating the test statistic.
$$ \text{Test statistic} = \cfrac { (\text{sample statistic} – \text{hypothesized value})}{\text{Standard error of the sample statistic}} $$
The test statistic is a random variable that changes from one sample to another. The following table gives a brief outline of the various test statistics used regularly, based on the distribution the data presumably follows:
$$
\begin{array}{l|r}
\text{Hypothesis Test} & \text{Test statistic} \\
\text{Z-test} & \text{Z-statistic (normal distribution)} \\
\text{Chi-square test} & \text{Chi-square statistic} \\
\text{t-test} & \text{t-statistic} \\
\text{ANOVA} & \text{F-statistic} \\
\end{array}
$$
We can subdivide the set of values that the test statistic can take into two regions: the non-rejection region, which is consistent with the H0, and the rejection region (critical region), which is inconsistent with the H0. If the test statistic has a value found within the critical region, we reject the H0.
Like with any other statistic, the distribution of the test statistic must be completely specified under the H0 when the H0 is true.
While using sample statistics to draw conclusions about the parameters of an entire population, there is always the possibility that the sample collected does not accurately represent the population. Consequently, statistical tests carried out using such sample data may yield incorrect results that may lead to erroneous rejection (or lack thereof) of the null hypothesis. We have two types of errors:
Type I error occurs when we reject a true null hypothesis. For example, a type I error would manifest in rejecting H0 = 0 when it is actually zero.
Type II error occurs when we fail to reject a false null hypothesis. In such a scenario, the test provides insufficient evidence to reject the null hypothesis when it is actually false.
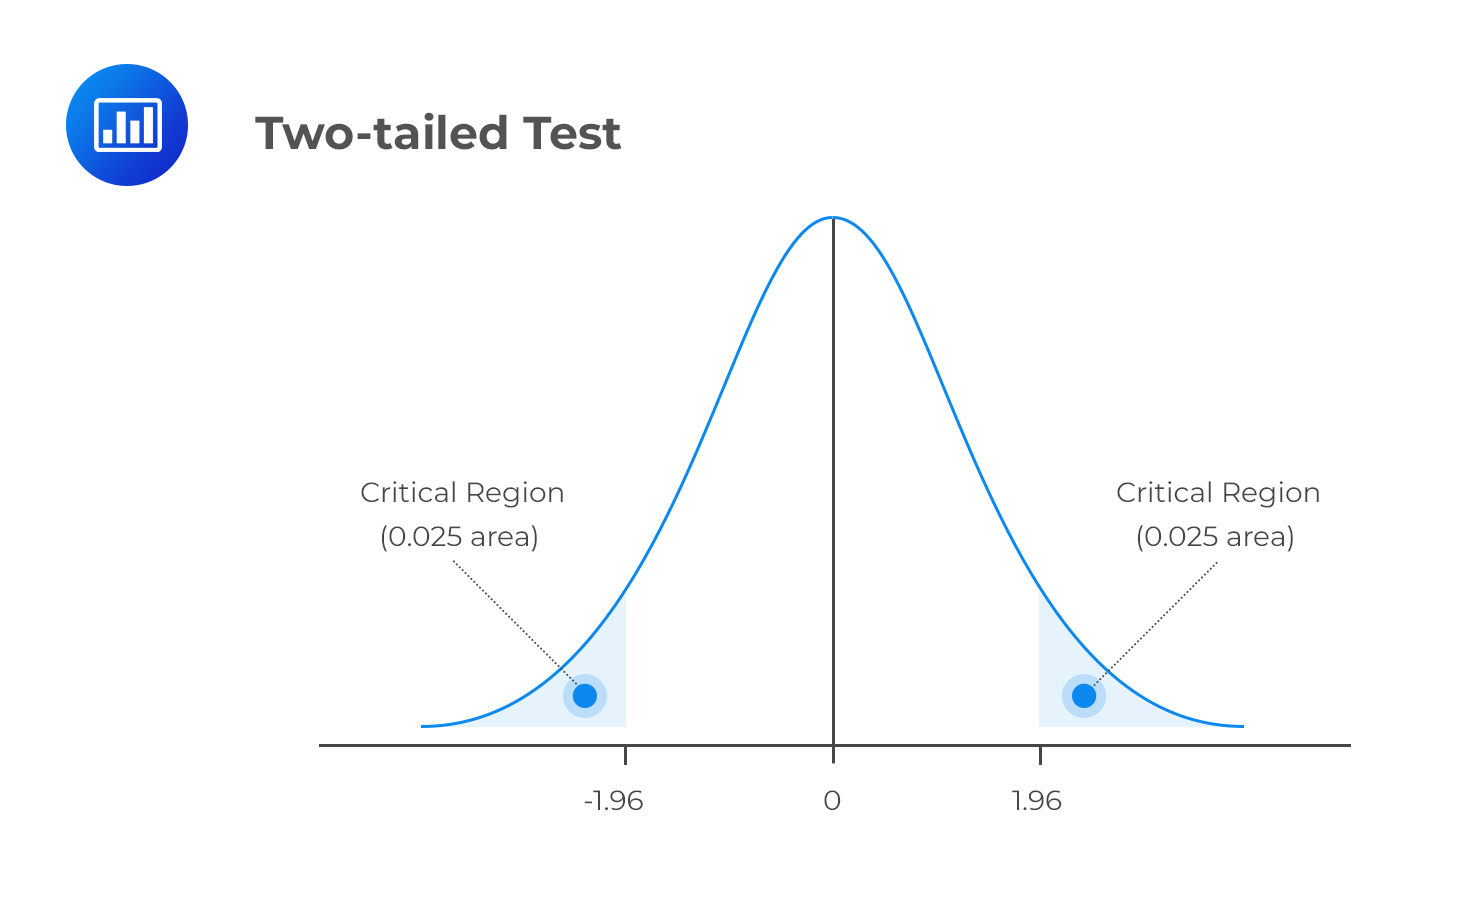
The level of significance, denoted by α, represents the probability of making a type I error, i.e., rejecting the null hypothesis when it’s true. α is the direct opposite of β, which is the probability of making a type II error within the bounds of statistical testing. The ideal but practically impossible statistical test would be one that simultaneously minimizes α and β. We use α to determine critical values that subdivide the distribution into the rejection and the non-rejection regions. The figure below gives an example of the critical regions under a two-tailed normal distribution and 5% significance level:


Get Ahead on Your Study Prep This Cyber Monday! Save 35% on all CFA® and FRM® Unlimited Packages. Use code CYBERMONDAY at checkout. Offer ends Dec 1st.