


The Central Limit Theorem
The central limit theorem asserts that “given a population described by any probability... Read More

To test the relationship between two categorical variables, we use a contingency table and a test of independence based on a chi-square distribution. The test statistic is calculated as follows:
$$
\chi^{2}=\sum_{i=1}^{m} \frac{\left(O_{i j}-E_{i j}\right)^{2}}{E_{i j}}
$$
Where :
\(E_{i j}=\frac{(\text { Total row } i) \times(\text { Total column } j)}{\text { Overall total }}\)
\(m\) = Number of cells in the table, the number of groups in the first class, multiplied by the number of groups in the second class.
\(O_{i j}\) = Number of observations in each cell of row i and column j (i.e., observed frequency).
\(E_{i j}\) = Expected number of observations in each cell of row i and column j, assuming independence (i.e., expected frequency).
The degrees of freedom is given by:
$$\text{Degrees of freedom} = (r-1)(c-1)$$
Where:
\(r\) = Number of rows.
\(c\) = Number of columns.
Example: Testing Independence Based on Contingency Table Data
The following contingency table shows the responses of two categories of investors (employed vs. retired) with regard to their primary investment objectives (growth, income, or both). The total sample size is 173.
$$
\begin{array}{l|c|c|c|c}
{} & \textbf { Growth } & \textbf { Income } & \textbf { Both } & \textbf { Total } \\
\hline \text { Employed } & 52 & 25 & 10 & 87 \\
\hline \text { Retired } & 32 & 47 & 7 & 86 \\
\hline\textbf{ Total } & 84 & 72 & 17 & 173 \\
\end{array}
$$
Use a 95% significance level to test whether there is any significant difference between employed and retired investors with regard to primary investment objectives.
Solution
\(H_0\): There is no significant difference between employed and retired investors with regard to primary investment objectives.
\(H_α\): There is a significant difference between employed and retired investors with regard to primary investment objectives.
Step 1: We calculate the expected frequency of investors by their category (employed vs. retired) and investment objective using the following formula:
$$ E_{i j}=\frac{(\text { Total row } i) \times(\text { Total column } j)}{\text { Overall total }} $$
$$\begin{array}{l|c|c|c}
{} & \textbf { Growth } & \textbf { Income } & \textbf { Both } \\
\hline \text { Employed } & \frac{\left(87\times 84\right)}{173}=42 & \frac{\left(87\times 72\right)}{ 173}=36 & \frac{\left(87\times 17\right)}{173}=9 \\
\hline \text { Retired } & \frac{\left(86\times 84\right)}{173}=42 & \frac{\left(86\times 72\right)}{173}=36 & \frac{\left(86\times 17\right)}{ 173}=8 \\ \hline \textbf { Total } & \mathbf{8 4} & \mathbf{7 2} & \mathbf{1 7} \\
\end{array} $$
Step 2: We calculate the scaled squared deviation for each combination of investor category and investment objective as follows:
$$ \begin{array}{l|c|c|c}
& \textbf { Growth } & \textbf { Income } & \textbf { Both } \\
\hline \text { Employed } & \frac{(52-42)^{2}}{ 42}=2.254 & \frac{(25-36)^ 2}{ 36}=0.469 & \frac{(10-9)^2}{9}=0.246 \\
\hline \text { Retired } & \frac{(32-42)^{2}}{42}=2.280 & \frac{(47-36)^2}{36}=3.510 & \frac{(7-8)^2}{8}=0.249\\
\hline \textbf { Total } & 4.534 & 6.979 & 0.495 \\
\end{array} $$
Step 3: We calculate the value of \(X^2 = 4.532 + 6.976 + 0.494 = 12.002\).
$$ \chi^2=4.534+6.979+0.495=12.008 $$
Step 4: The critical value of \(X^2\) is 5.99. It is determined using the following:
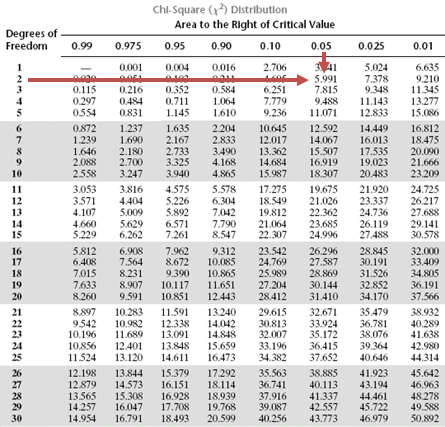
Decision rule: The calculated value of \(\chi^2 =12.008\) is greater than the critical value of 5.99. As such, there is sufficient evidence to support the conclusion that retired investors and employed investors have different primary investment objectives.


Get Ahead on Your Study Prep This Cyber Monday! Save 35% on all CFA® and FRM® Unlimited Packages. Use code CYBERMONDAY at checkout. Offer ends Dec 1st.