


Tracking Error
Tracking error refers to the difference in returns between a portfolio (index fund)... Read More

A tree diagram is a visual representation of all possible future outcomes and the associated probabilities of a random variable. Tree diagrams are handy when we have several possible outcomes.
They facilitate the recording of all the possibilities in a clear, uncomplicated manner. Each branch in a tree diagram represents an outcome.
Example: Probability Tree
Let’s consider a scenario where we toss a fair coin twice. The outcomes of these tosses are independent, meaning the first toss doesn’t influence the second one.
For the first toss, we have two possibilities: It can result in either a head or a tail. Similarly, we still have the same two possibilities for the second toss: head or tail. Importantly, the outcome of the second toss is not affected by what happened in the first toss because coins don’t have memory.
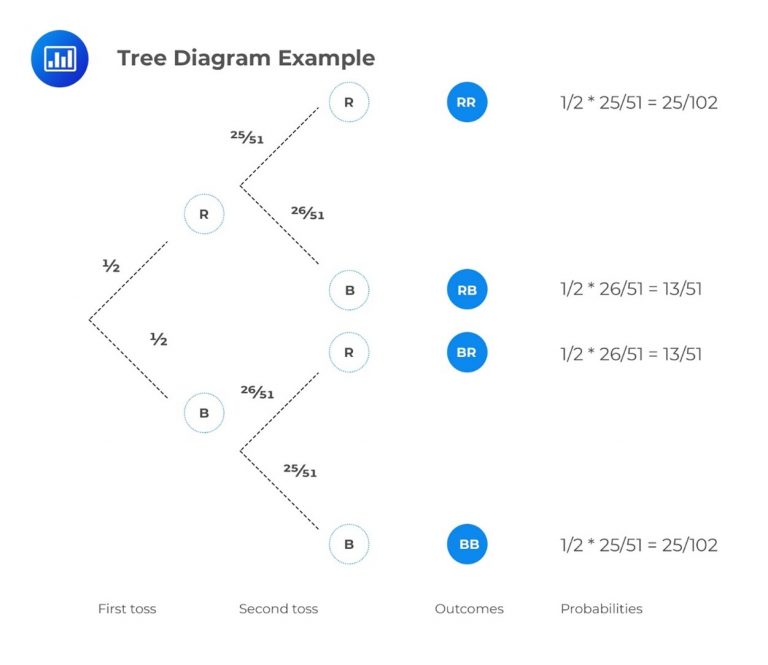
We can visualize these probabilities using a tree diagram like this:

Please, note the following:
To calculate probabilities, we follow the tree branches from left to right and multiply any probabilities we encounter.
So, to find the probability of getting two heads (HH), we multiply the probabilities along the path.
$$ P(HH)=\frac {1}{2} \times \frac {1}{2}=\frac {1}{4} $$
If we sum up the probabilities of all possibilities, we get 1.
In investments, conditional expectation means predicting the expected value of an investment based on specific real-world events. Analysts consider the probability and impact of future events when calculating this value.
Competitors, governments, and other financial institutions keep releasing new information. Such pieces of information may have a positive or a negative impact on investment. This means that a project’s expected value must be based on real-world dynamics.
In statistics, the conditional expected value is the expected value of a random variable \(X\) given an event or scenario \(S\), denoted by \(E(X \mid S)\).
Now, assume that \(X\) can take on any of \(n\) different outcomes \(X_1, X_2,\ldots, X_n\), which are outcomes from a set of mutually exclusive and exhaustive events. Then,
$$ \begin{align*}
E(X \mid S)& =X_1\cdot P(X_1 \mid S)+X_2\cdot P(X_2\mid S)+\cdots +X_n \cdot P(X_n \mid S) \\
& =\sum_{i=1}^n X_i \cdot P(X_i \mid S)
\end{align*} $$
To state the unconditional expected values in terms of conditional expected value, we use the total probability rule for expected value, which is built from the following formula:
$$ E(X)=P(S)\cdot E(X \mid S)+P(S^C )\cdot E(X \mid S^C) $$
Where \(S^C\) is the complement (event or scenario “S” does not occur) of \(S\).
Now assume that \(S\) can take on any of \(S_1, S_2,\ldots, S_n\) mutually exclusive and exhaustive scenarios or events, then.
$$ \begin{align*}
E(X) & =P(S_1)\cdot E(X \mid S_1)+P(S_2)\cdot E(X \mid S_2)+\cdots+P(S_n )\cdot E(X \mid S_n) \\
& =\sum_{i=1}^n P(S_i)\cdot E(X \mid S_i) \end{align*} $$
Example: Conditional Expectation
The probability of relaxed trade restrictions in a given country is 40%. Therefore, shareholders of XYZ Company Limited expect a 5% share return if trade restrictions are maintained and a loss of 8% if they are relaxed. The expected change in return is closest to:
Solution
We must take every possibility into account. We have a 40% chance of relaxed trade restrictions in this case. Intuitively, this means there is a 60% chance that the current restrictions will be maintained. Therefore:
$$ \begin{align*}
E(X)& =\sum_{i=1}^n P(S_i)\cdot E(X \mid S_i) \\
& =0.6(0.05) + 0.4(-0.08) \\
& =-0.2\%
\end{align*} $$
Example: Total Probability Rule for Expected Value
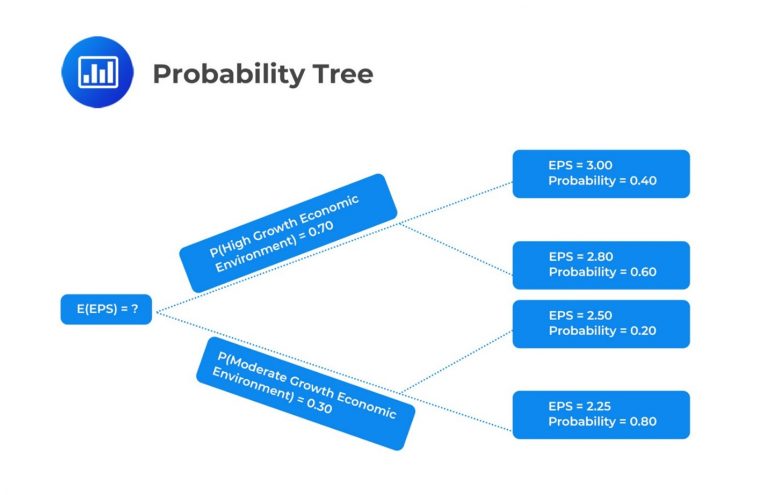
BlueChip Inc.’s profits are sensitive to economic growth, benefitting significantly during periods of high economic growth. Suppose there is a 0.70 probability that BlueChip Inc. will operate in a high-growth economic environment in the next fiscal year and a 0.30 probability that it will operate in a moderate-growth environment. Assume that the chance of a recession is negligible.
If a high-growth economic environment occurs, the probability that EPS will be USD 3.00 is estimated at 0.40, and the probability that EPS will be USD 2.80 is estimated at 0.60.
On the other hand, if the company operates in a moderate-growth environment, the probabilities that the EPS will be USD 2.50 and USD 2.25 are 20% and 80%, respectively.
Calculate the expected value of EPS for BlueChip Inc. in the next fiscal year.
Solution
We start by drawing a probability tree:
We first need to calculate the conditional expectations of EPS for each scenario: High-growth environment and moderate-growth environment. That is,
$$ \begin{align*}
E(EPS\mid \text{High-growth environment})&=0.40 \times 3.00+0.60 \times 2.80 \\
&=\text{USD } 2.88 \\
E(EPS \mid \text{Moderate-growth environment})&=0.20 \times 2.50+0.80 \times 2.25 \\
&=\text{USD } 2.30
\end{align*} $$
Using the total probability for the expected value, we have:
$$ \begin{align*}
E(EPS) & =P(\text{High-growth environment}) \\ & \cdot E(EPS \mid \text{High-growth environment}) \\ & +P(\text{High-growth environment}) \\ & \cdot E(EPS?\text{Moderate-growth environment}) \\
&=0.70 \times 2.88+0.30 \times 2.30 \\
& =\text{USD } 2.71
\end{align*} $$
Question 1
Someone picks a card from an ordinary pack of 52 playing cards without replacement. He then picks another one. Draw a probability tree and use it to calculate the probability of picking two red cards.
- \(\frac {25}{102}\).
- \(\frac {13}{51}\).
- \(\frac {26}{51}\).
Solution
The correct answer is A.
Question 2
There is a 20% chance that the government will impose a tariff on imported cars. A company that assembles cars locally expects returns of 14% if the tariff is imposed and returns of 11% otherwise. The (unconditional) expected return is closest to:
- 11.6%.
- 12.8%.
- 12.5%.
Solution
The correct answer is A.
The unconditional expected return will be the sum of:
- The expected return given no tariff times the probability that a tariff will not be imposed.
- The expected return given tariff times the probability that the tariff will be imposed. Therefore,
$$ \begin{align*}
E(X) & =\sum_{i=1}^n P(S_i ) E(X \mid S_i) \\
&=0.11(0.8) + 0.14(0.2) \\
& =0.116=11.6\% \end{align*} $$
Master CFA Level I probability tree concepts including conditional expectations, joint probabilities, Bayes’ formula, discrete random variables, and probability distributions with AnalystPrep’s study resources.


Get Ahead on Your Study Prep This Cyber Monday! Save 35% on all CFA® and FRM® Unlimited Packages. Use code CYBERMONDAY at checkout. Offer ends Dec 1st.