


Continuous Uniform Distribution
The continuous uniform distribution is such that the random variable X takes values... Read More

When testing for the difference between two population means, independent samples may introduce some caveats. The real difference can be masked by variability within each sample caused by factors other than those of interest to the researcher. Random variation within a sample can be so large that it blurs the real difference – that which has been caused by a phenomenon or factor in which an analyst is interested. For this reason, a paired data test may be preferred.
As a way of controlling the external variability, data analysts often collect a pair of responses from each subject. They then compute and work with the differences within pairs.
A group of financial analysts wishes to determine whether the payment of dividends has a significant effect on the share price. Sample data on share prices can be collected from a set of companies prior to the payment of dividends, say, 7 days before dividend announcements. To ensure the samples are independent, the companies should be in the same line of business. This would ensure that all of them are susceptible to similar specific risks and other business-related conditions. Seven days after all the companies have paid the dividends, the analysts can recollect data from each company. The analysts would end up with paired data from each company. Such data can then be used to establish if any significant differences exist between pre-dividend and post-dividend share prices.
The overriding assumption during paired data tests is that the observed differences constitute a sample from a normal distribution.
Basic Situation
H0: μD (= μ1 – μ2) = σ
The test statistic is
$$ \frac { \bar { D } -\sigma }{ \frac { { S }_{ D } }{ \sqrt { n } } } \sim { t }_{ n-1 } \text{ under } { H }_{ 0 } $$
In case n is large, the normal distribution assumption is not necessary.
Doctors in a certain general hospital wish to determine if a special diet can reduce body weight. To do this, they select ten overweight patients with an average body weight of 77 kg (B’). After being subjected to the special diet, the average weight reduces to 75 kg (A’).
Test whether the special diet reduces body weight.
Additional information: \( \sum (B_i – A_i)^2 = 70 \quad \quad i = 1, 2, 3, …, 9, 10.\)
Solution
As always, begin by stating the hypothesis:
H0: μA = μB
H1: μA < μB
Where A stands for “after” and B is “before.”
The test statistic is:
$$ \frac { \bar { D } -\sigma }{ \frac { { S }_{ D } }{ \sqrt { n } } } \sim { t }_{ n-1 }\quad under\quad { H }_{ 0 } $$
Where Di is the difference within each pair (Ai – Bi).
$$ \begin{align*} D’ & = A’ – B’ = 75 – 77 = -2 \\ S_D^2 & =\cfrac {1}{(n – 1)} \left( \sum D_i – D’ \right)^2 =\cfrac {1}{(n – 1)} \left\{ \sum D_i^2 – {nD’}^2 \right\} \\ & =\cfrac {1}{9} \left\{ 70 – 10(-2^2) \right\} = 3.333 = 1.826^2 \end{align*} $$
Therefore,
$$ \text{Test statistic} =\cfrac {(75 – 77)}{\left( \frac {1.826}{\sqrt{10}} \right)} = -3.591 $$
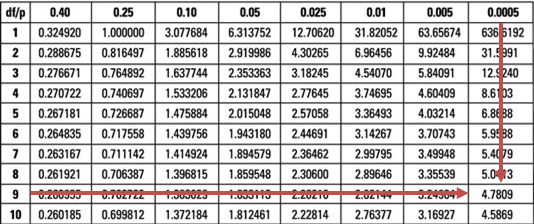
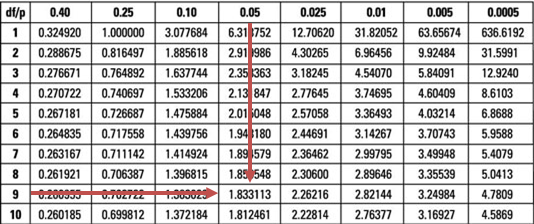
The test statistic (-3.591) is lower than the lower 5% point of the t-distribution at 9 degrees of freedom (-1.833).
This gives us sufficient evidence to reject the H0 at 5% significance. Therefore, it would be very reasonable to conclude that the special diet reduces body weight.
Question
Repeat the example above using a significance level of just 0.05% and state the decision rule.
A. Reject the H0 and conclude that the special diet reduces body weight.
B. Do not reject the H0 and conclude that the special diet has an insignificant effect on body weight.
C. Reject the H0 and conclude that the special diet has an insignificant effect on body weight.
Solution
The correct answer is B.
The observed test statistic still remains -3.591. The lower 0.05% point of the t9 distribution is -4.781.
It is clear that the test statistic is way above the t9 distribution, i.e., it lies outside the critical or rejection region. Therefore, we would not reject the H0.
Note to candidates: Reducing the significance level basically reduces the probability of rejecting a true null hypothesis (type I error).


Get Ahead on Your Study Prep This Cyber Monday! Save 35% on all CFA® and FRM® Unlimited Packages. Use code CYBERMONDAY at checkout. Offer ends Dec 1st.