


Measures of Return
Financial assets are primarily defined based on their return-risk characteristics. This definition approach... Read More

Sampling is the systematic process of selecting a subset or sample from a larger population. Sampling is essential because it is costly and time-consuming to analyze the whole population.
Sampling methods can be broadly categorized into probability sampling and non-probability sampling.
In probability sampling, every population member has an equal chance of being chosen for the sample, ensuring a representative sample. In contrast, non-probability sampling depends on factors such as the sampler’s judgment or data accessibility, increasing the risk of an unrepresentative sample.
Simple random sampling means selecting a sample from a population where each element has an equal chance of being chosen. This method aims to create an unbiased sample that accurately represents the population.
Simple random sampling is appropriate when applied to a homogeneous population.
Example: Simple Random Sampling
Imagine we wish to come up with a sample of 50 CFA level I candidates out of 100,000.
One approach may involve numbering each of the 100,000 candidates, placing them in a basket, and shaking the basket to jumble up the numbers. Next, we would randomly draw 50 numbers from the basket, one after the other, without replacement.
A more scientific approach may also involve the use of random numbers. All the 100,000 candidates are numbered in a sequence (from 1 to 100,000). We may then use a computer to randomly generate 50 numbers between 1 and 100,000, where a given number represents a particular candidate whose name or admission number can be identified.
The underlying feature of random sampling is that all elements in the population must have equal chances of being chosen.
In stratified random sampling, analysts subdivide the population into separate groups known as strata (singular stratum). Each stratum comprises elements with a common characteristic (attribute) that distinguishes them from all the others. The method is most appropriate for large heterogeneous populations.
A simple random sample is then drawn from within each stratum and combined to form the overall, final sample that takes heterogeneity into account. The number of members chosen from any one stratum depends on its size relative to the population as a whole.
Example: Stratified Random Sampling
An advertising firm wants to determine the extent to which it needs to invigorate television advertisements in a district. The company decides to conduct a survey to estimate the mean number of hours households spend watching TV per week. The district has three distinct towns – \(A\), \(B\), which are urbanized, and \(C\), located in a rural area. Town \(A\) is adjacent to a major factory where most residents work, with most having kids of school-going age. Town \(B\) mainly harbors retirees, while most people in town \(C\) practice agriculture.
There are 160 households in town \(A\), 60 in town \(B\), and 80 in \(C\). Given the differences in the composition of each region, the firm decides to draw a sample of 50 households, considering the total number of families in each.
What is the number of homes that have been sampled in each town?
Solution
We have three strata: towns \(A\), \(B\), and \(C\). We use the following formula to determine the number of households from each region to be included in the sample:
$$ \begin{align*} & \text{Number of households in sample}\\ & =\left(\frac{\text{Number of households in the region}}{\text{Total number of households}}\right)\times \text{Required sample size} \end{align*} $$
Therefore, the number of households to be sampled in town \(A\),
$$ =\frac{160}{300}\times50=27 \left(\text{approximately}\right) $$
Similarly, the number of households to be sampled in town \(B\),
$$ =\frac{60}{300}\times50=10 $$
Finally, the firm would need \(\left(\frac{80}{300}\times50\right)=13\) households in town \(C\).
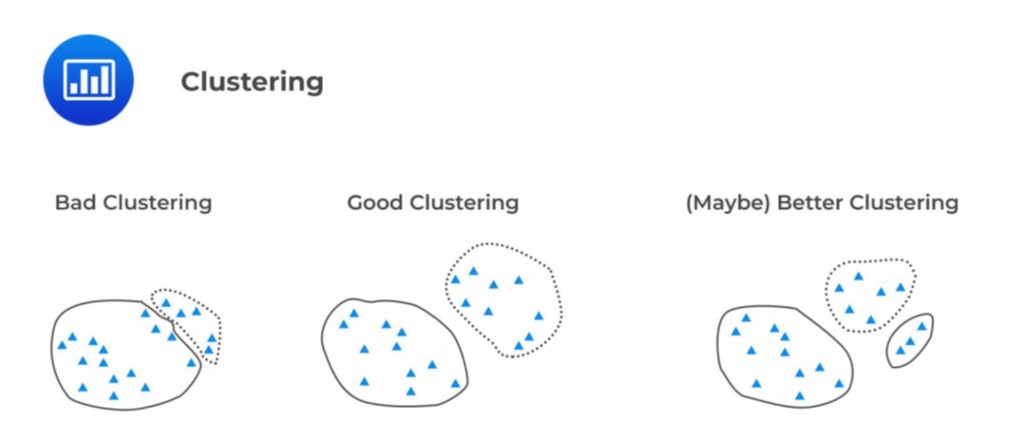
Cluster sampling involves categorizing all population elements into distinct and all-encompassing groups called clusters. Then, you can either choose a random sample of entire clusters or select a random subset from each cluster. So, there are two cluster sampling approaches:
Non-probability samples are selected based on judgment or the convenience of accessing data. As such, non-probability sampling depends on the researchers’ sample selection skills. There are two types of non-probability sampling methods:
Judgmental sampling is preferred when a restricted number of people in a population possess qualities that the researcher expects from the target population.
$$ \begin{array}{l|l|l}
\textbf{Method} & \textbf{Strengths} & \textbf{Weaknesses} \\ \hline
\textbf{Probability Sampling} & & \\ \hline
\text{Simple random sampling} & \text{Easy to use} & \text{Lower precision;} \\
& & \text{no assurance of} \\
& & \text{representativeness} \\ \hline
\text{Stratified sampling} & \text{Higher precision} & \text{Difficult to choose} \\
& \text{relative to simple} & \text{relevant stratification;} \\
& \text{random sampling} & \text{expensive} \\ \hline
\text{Cluster sampling} & \text{Cost-effective and} & \text{Lower precision} \\ & \text{efficient} & \\ \hline
\textbf{Non-probability} & & \\ \textbf{Sampling} & & \\ \hline
\text{Convenience sampling} & \text{Cost-effective and} & \text{Selection bias, sample} \\
& \text{saves time; easy } & \text{may not accurately} \\
& \text{to use} & \text{represent population} \\ \hline
\text{Judgmental sampling} & \text{Cost-effective,} & \text{Subjective method.} \\
& \text{convenient, less time} & \text{Selection bias, sample} \\
& \text{consuming} & \text{may not accurately} \\
& & \text{represent the population.} \\
\end{array} $$
Sampling error refers to the difference between the observed value (results obtained from analyzing a sample of investment data) and the true values that would have been obtained from analyzing the entire population of investments.
For instance, when we take a sample to estimate a population’s mean, there’s typically a difference between the sample mean and the true population mean. This difference, known as sampling error, emerges due to natural variation in sampling and because we work with data from only a part of the full population.
Therefore, any conclusions or predictions drawn based on the sample data may deviate from the actual performance or characteristics of the entire investment population.
Question 1
An analyst is analyzing the spending habits of people belonging to different annual income categories. In his analysis, he creates the following different groups according to the annual family income: Less than $30,000, $31,000 – $40,000, $41,000 to $50,000, and $51,000 to $60,000. He then selects a sample from each distinct group to form a whole sample. The sampling method used by the analyst is most likely:
A. Cluster sampling.
B. Stratified sampling.
C. Simple random sampling.
Solution
The correct answer is B.
Dividing the population into different strata/groups and selecting a sample from each group is called the stratified sampling technique.
A is incorrect. In cluster sampling, each cluster is considered a sampling unit, and only selected clusters are sampled.
C is incorrect. Simple random sampling involves the selection of a sample from an entire population such that each member or element of the population has an equal probability of being picked.
Question 2
A Ph.D. student is conducting research related to her thesis, and for this purpose, she uses some students from her university to constitute a sample. The sampling method used by the analyst is most likely:
A. Simple random sampling.
B. Convenience sampling.
C. Judgmental sampling.
Solution
The correct answer is B.
The researcher has selected the students from her university because she can conveniently access them.
A is incorrect. Simple random sampling involves the selection of a sample from an entire population such that each member or element of the population has an equal probability of being picked.
C is incorrect. Judgmental sampling involves handpicking elements from a sample based on the researcher’s knowledge and expertise.
Question 3
An analyst wants to estimate the downtime of ABC Bank’s ATMs in a city for the last six months. For this purpose, he selects 20 locations or areas within the city and then selects 50% of the ATMs in each area. The sampling method used by the analyst is most likely:
A. Cluster sampling.
B. Stratified random sampling.
C. Simple random sampling.
Solution
The correct answer is A.
In cluster sampling, all population elements are categorized into mutually exclusive and exhaustive groups called clusters. A simple random sample of the cluster is selected, and then the elements in each of these clusters are sampled.
B is incorrect. In stratified random sampling, analysts subdivide the population into separate groups known as strata (singular–stratum), and each stratum is composed of elements that have a common characteristic (attribute) that distinguishes them from all the others.
C is incorrect. Simple random sampling involves the selection of a sample from an entire population such that each member or element of the population has an equal probability of being picked.


Get Ahead on Your Study Prep This Cyber Monday! Save 35% on all CFA® and FRM® Unlimited Packages. Use code CYBERMONDAY at checkout. Offer ends Dec 1st.