


Technical Analysis Charts
Technical analysis charts are graphical displays that show asset price and trade volume... Read More

An optimal portfolio is the combination of investments that provides the highest expected utility for a given level of risk. Rather than simply maximizing returns, portfolio selection involves balancing expected returns with an investor’s willingness to accept uncertainty.
Every investor has different financial objectives and levels of risk tolerance. As a result, two investors may choose different portfolios even when evaluating the same investment opportunities. Concepts such as utility functions, indifference curves, and the Capital Allocation Line (CAL) help explain how investors select portfolios that best align with their preferences.
In this study note, you’ll learn:
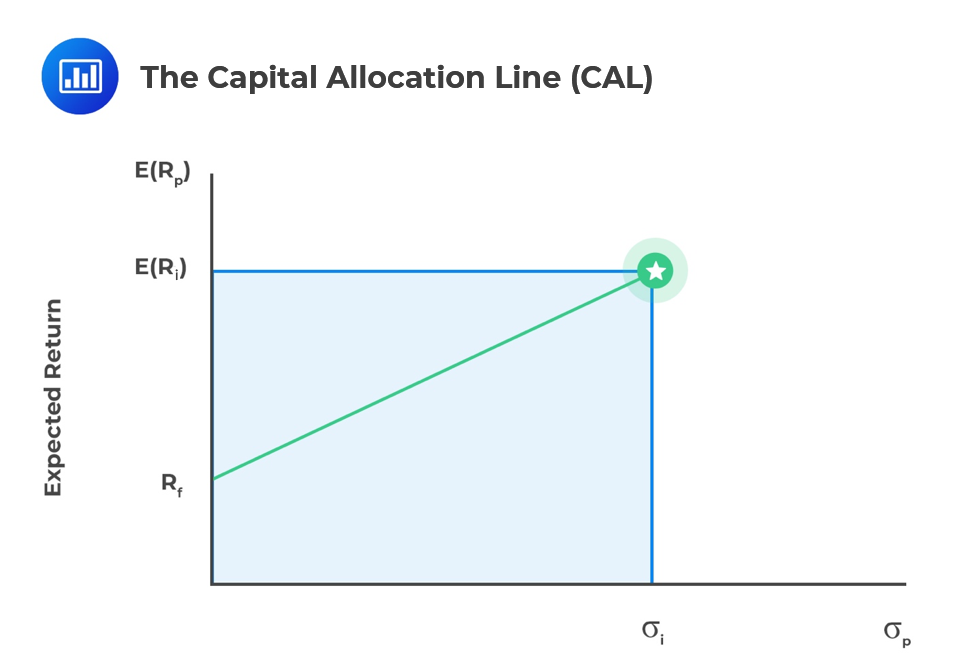
Risk-free assets are usually government-issued with no risk. When you combine them with risky assets, you create a capital allocation line on a graph. This line connects the best risky portfolio to the risk-free asset.
The two-fund separation theorem says all investors, no matter their preferences or wealth, use two funds: a risk-free one and a portfolio of risky assets. This splits portfolio building into two steps: first, we pick the best mix of risky assets based on their characteristics. Then, we decide how much to allocate to the risk-free asset based on the investor’s risk preference. Combining the risk-free asset with the risky portfolio makes the capital allocation line (CAL) on a graph.
Selecting an optimal portfolio involves combining investment opportunities with an investor’s personal risk preferences.
The process typically follows these steps:
Although all investors may have access to the same investment opportunities, differences in risk tolerance often lead them to select different portfolios.
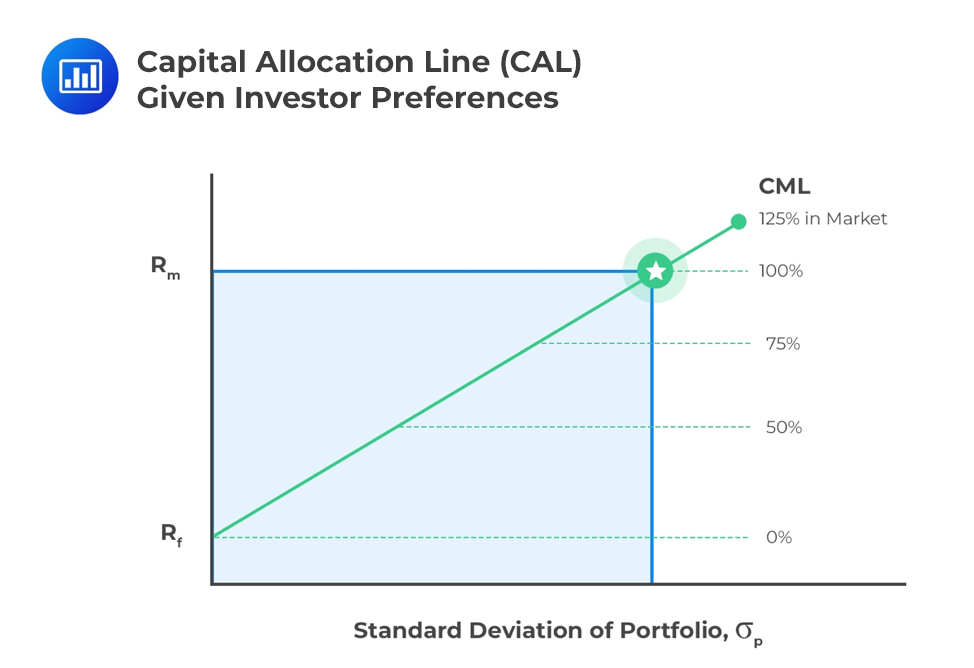
A highly risk-averse investor may choose to invest only in a risk-free asset. On the contrary, a less risk-averse investor may have a small portion of their wealth invested in the risk-free asset and a large portion invested in the risky portfolio. An investor with a high-risk tolerance may, in fact, choose to borrow from the risk-free asset and invest in a risky portfolio. This enables the investor to invest more than 100% of their assets and create a leveraged portfolio.
Suppose two investors each have $500,000 to invest.
Investor A is approaching retirement and prioritizes preserving wealth. They allocate a larger proportion of their portfolio to government bonds and cash while maintaining a smaller allocation to equities.
Investor B has a long investment horizon and is comfortable with greater market fluctuations. They invest most of their portfolio in equities and allocate only a small proportion to fixed-income securities.
Although both investors have access to the same investment opportunities, each chooses a different optimal portfolio because of differing levels of risk aversion.
| Investor Type | Risk Tolerance | Typical Portfolio Choice |
| Highly Risk-Averse | Low | Large allocation to risk-free assets |
| Moderately Risk-Averse | Moderate | Balanced mix of risky and risk-free assets |
| Risk-Tolerant | High | Larger allocation to risky assets |
| Risk-Seeking | Very High | May borrow to increase exposure to risky assets |
This table reinforces how investor preferences influence optimal portfolio selection.
Utility is a measure of relative satisfaction that an investor derives from different portfolios. We can generate a mathematical function to represent this utility that is a function of the portfolio’s expected return, the portfolio variance, and a measure of risk aversion.
$$\text{U}=\text{E(r)}-\frac{1}{2}\sigma^2$$
Where:
U = Utility.
E(r) = Portfolio expected return.
A = Risk aversion coefficient.
\(\sigma^2\) = portfolio variance.
To determine risk aversion (A), we measure the marginal reward an investor needs in order to take more risk. A risk-averse investor will need a high-margin reward for taking more risks. The utility equation shows the following:
The risk aversion coefficient, A, is positive for risk-averse investors (any increase in risk reduces utility). It is 0 for risk-neutral investors (changes in risk do not affect utility) and negative for risk-seeking investors (additional risk increases utility).
Utility functions provide a practical way to compare portfolios that have different levels of expected return and risk.
Instead of focusing solely on returns, utility functions recognize that investors value certainty differently. The optimal portfolio is therefore the one that delivers the highest level of satisfaction (utility) given an investor’s individual risk preferences.
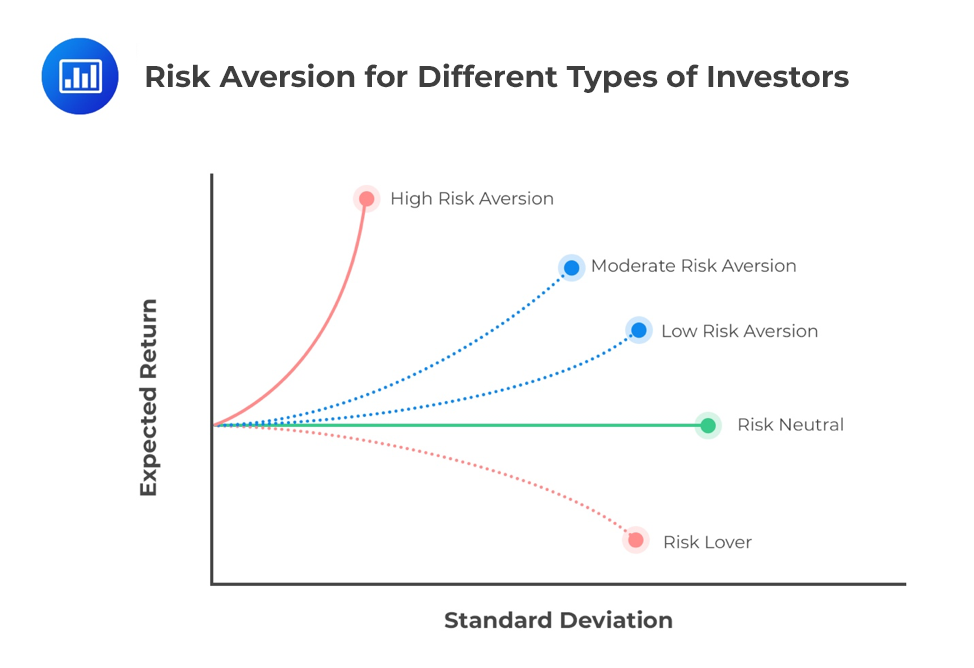
An indifference curve plots the combination of risk and returns that an investor would accept for a given level of utility. For risk-averse investors, indifference curves run “northeast” since an investor must be compensated with higher returns for increasing risk. It has the steepest slope. A more risk-seeking investor has a much flatter indifference curve as their demand for increased returns as risk increases is much less acute.
We can overlay an investor’s indifference curve with the capital allocation line to determine their optimal portfolio.
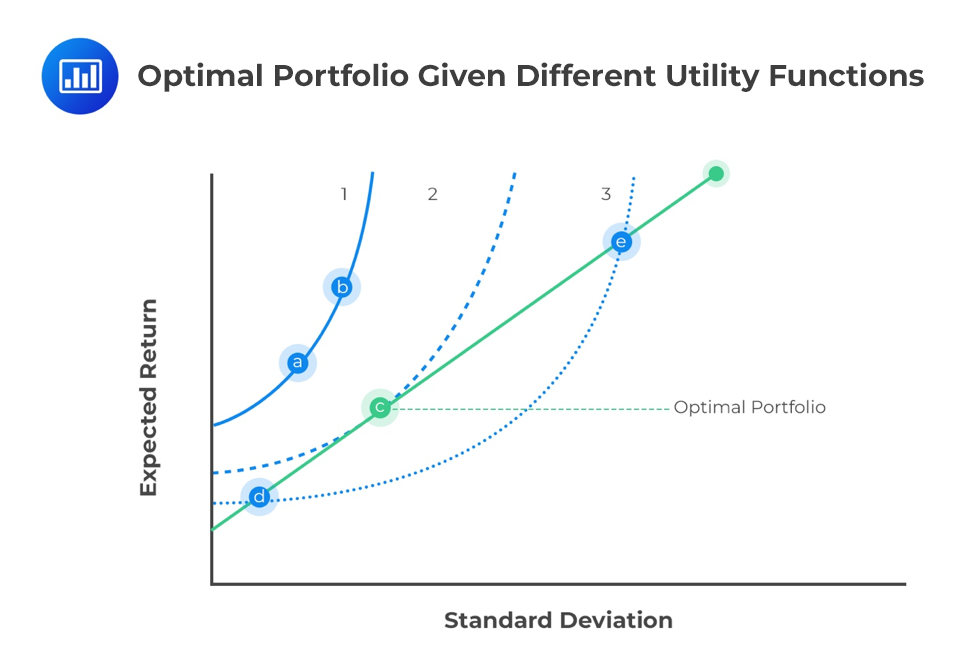
Optimal Portfolio — The portfolio that provides the highest utility for a given investor.
Utility Function — A mathematical representation of an investor’s preferences regarding risk and return.
Indifference Curve — A curve showing combinations of risk and return that provide the same level of investor satisfaction.
Capital Allocation Line (CAL) — A line representing combinations of a risk-free asset and a risky portfolio.
Risk Aversion Coefficient — A measure of how strongly an investor dislikes risk.
An optimal portfolio is the combination of investments that provides the highest expected utility based on an investor’s risk preferences.
An optimal portfolio is selected by combining the efficient frontier, the Capital Allocation Line, and the investor’s utility function to identify the portfolio that maximizes satisfaction.
Different investors have different levels of risk aversion, financial goals, and investment horizons, which influence their preferred balance between risk and return.
The Capital Allocation Line represents combinations of a risk-free asset and a risky portfolio available to investors.
An indifference curve shows combinations of expected return and risk that provide the same level of utility to an investor.
More risk-averse investors typically allocate more wealth to lower-risk investments, while less risk-averse investors allocate more to risky assets.
Utility helps explain why investors with similar return expectations may still choose different portfolios because they value risk differently.
These concepts form the foundation of modern portfolio selection.
Question
Using the utility function \(\text{U}=\text{E(r)}-\frac{1}{2}\sigma^2\) and assuming A = -4, which of the following statements best describes the investor’s attitude to risk?
A. The investor is risk-neutral.
B. The investor is risk-averse.
C. The investor is risk-seeking.
Solution
The correct answer is C.
A negative risk aversion coefficient (A = -4) means the investor receives a higher utility (more satisfaction) for taking more portfolio risk. A risk-averse investor would have a risk aversion coefficient greater than 0, while a risk-neutral investor would have a risk aversion coefficient equal to 0.
Work with efficient frontier scenarios, expected returns, and risk analysis through exam‑focused practice.


Get Ahead on Your Study Prep This Cyber Monday! Save 35% on all CFA® and FRM® Unlimited Packages. Use code CYBERMONDAY at checkout. Offer ends Dec 1st.