Risk Aversion
Risk aversion is related to investor behavior. Some investors are more comfortable with... Read More
In theory, we could form a portfolio made up of all investable assets. However, this is not practical, and we must find a way to filter the investable universe. A risk-averse investor wants to find a combination of portfolio assets that minimizes risk for a given level of return.
When constructing a portfolio, it’s important to consider both the expected return and the level of risk involved. These portfolio characteristics depend on the assets included and how they interact with each other, which is measured through correlation. To explore various investment opportunities, we adjust the allocation to each asset. Different allocations create portfolios with distinct risk and return profiles. These profiles can be visually represented on a graph, with the expected return on one axis and the standard deviation on the other. This visualization helps investors make informed decisions about their portfolios.
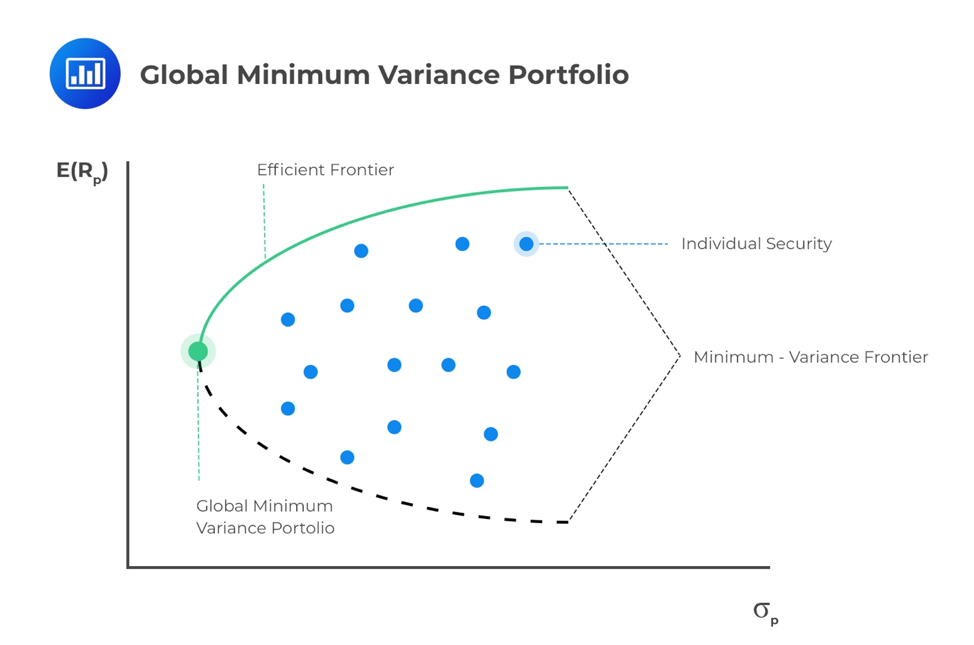
For each level of return, the portfolio with the minimum risk will be selected by a risk-averse investor. This minimization of risk for each level of return creates a minimum-variance frontier – a collection of all the minimum-variance (minimum-standard deviation) portfolios. At a point along this minimum-variance frontier curve, there exists a minimum-variance portfolio that produces the highest returns per unit of risk.
Along the minimum-variance frontier, the left-most point is a portfolio with minimum variance when compared to all possible portfolios of risky assets. This is known as the global minimum-variance portfolio. An investor cannot hold a portfolio of risky (note: risk-free assets are excluded at this point) assets with a lower risk than the global minimum-variance portfolio.
The portion of the minimum-variance curve that lies above and to the right of the global minimum variance portfolio is known as the Markowitz efficient frontier. It contains all portfolios that rational, risk-averse investors would choose. We can also monitor the slope of the efficient frontier, the change in units of return per unit of risk. As we move to higher levels of risk, the resulting increase in return begins to diminish. The slope begins to flatten. This means we cannot achieve ever-increasing returns as we take on more risk, quite the opposite. Investors experience a diminishing increase in potential returns as portfolio risk increases.

Question
Which statement best describes the global minimum-variance portfolio?
A. The global minimum variance portfolio gives investors the highest levels of returns.
B. The global minimum variance portfolio gives investors the lowest risk portfolio made up of risky assets.
C. The global minimum variance portfolio lies to the right of the efficient frontier.
Solution
The correct answer is B.
The global minimum variance portfolio lies to the far left of the efficient frontier. It is made up of a portfolio of risky assets that produces the minimum risk for an investor.
Practice minimum‑variance & portfolio‑optimization problems with full solutions.
Get Ahead on Your Study Prep This Cyber Monday! Save 35% on all CFA® and FRM® Unlimited Packages. Use code CYBERMONDAY at checkout. Offer ends Dec 1st.