


Market Value vs. Book Value of Equity ...
The book value of a company’s equity reflects the historical operating and financing... Read More

An industry is generally defined as a collection of companies that offer similar products or services as perceived from a customer’s perspective. For instance, Apple, Samsung, and Huawei can be grouped as they offer smartphones and related services. However, defining an industry can be complex due to several factors:
To help analysts navigate these challenges, third-party organizations maintain industry classification schemes. These schemes, such as the Global Industry Classification Standard (GICS), are widely used in investment management to categorize companies and facilitate industry analysis.
In the past, government agencies created early industry classification systems, like SIC (Standard Industrial Classification), NACE (Statistical Classification of Economic Activities in the European Community), and ISIC (International Standard Industrial Classification). These classification systems were tailored to individual countries and their specific needs.
These schemes grouped companies based on their production characteristics into industries such as agriculture, manufacturing, distribution, retail, and services. Moreover, these schemes were not updated frequently and became less useful with the emergence of new technologies and business models.
Modern industry classification schemes such as the Global Industry Classification Standard (GICS), Industry Classification Benchmark (ICB), and The Refinitiv Business Classification (TRBC) are global and updated at least annually.
Unlike legacy schemes, which use a “supply” approach, these schemes group companies based on the similarity of the products or services they sell, a “demand” approach. For example, Netflix and Disney+ would be grouped as they offer streaming services.
GICS and ICB cover public companies, while TRBC covers private companies, non-profits, and government entities. Data aggregators (such as Bloomberg and FactSet) and stock exchange operators use these industry classification schemes or have their own substantially similar ones.
GICS, ICB, and TRBC are hierarchical taxonomies similar to the taxonomy used in biology. In other words, a company is placed in a single group in the lowest tier, where groups make up the higher tiers.
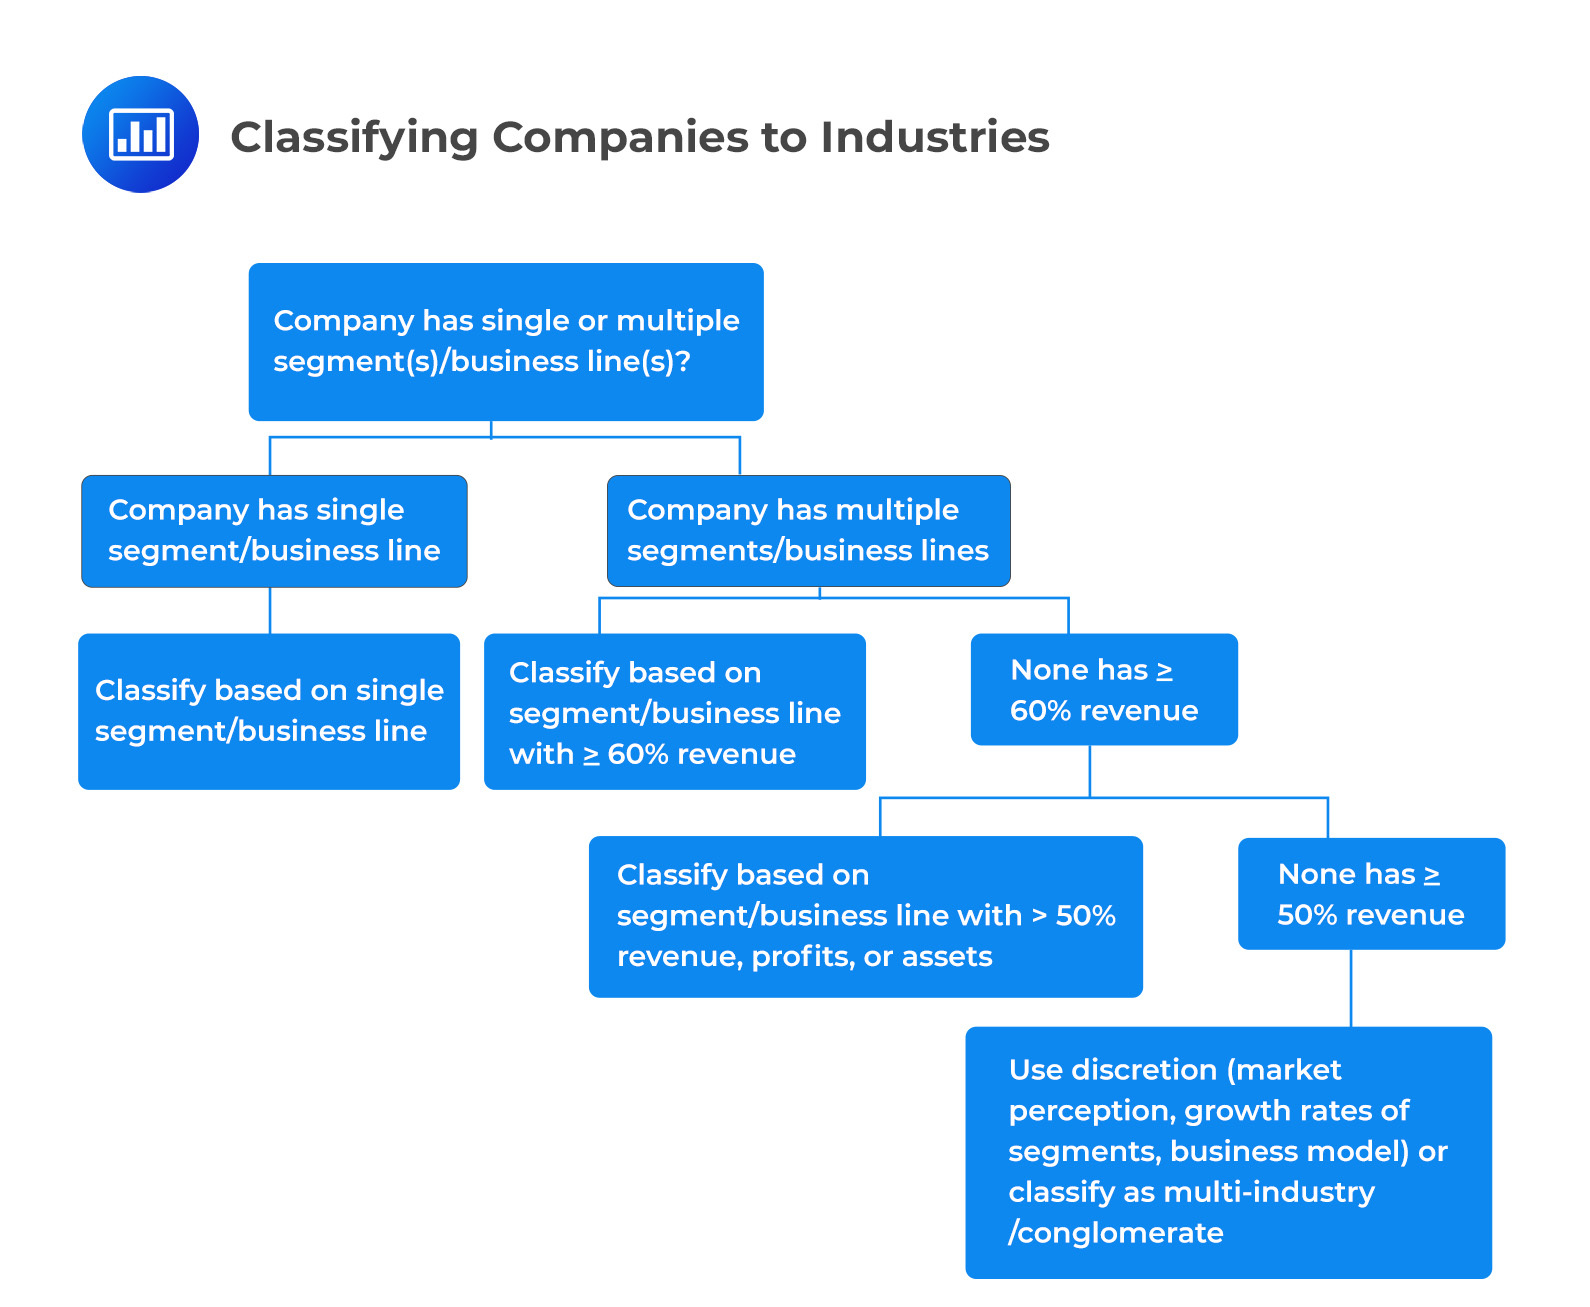
GICS, ICB, and TRBC each have distinct guidelines for classifying companies that operate across multiple industries, and all employ a certain degree of discretion. However, the process is similar, with the objective of classifying a company into a single grouping that describes most of its business.
The process is as follows:
GICS classification was jointly developed by Morgan Stanley Capital International (MSCI) and S&P Dow Jones Indices. These two financial institutions worked together to create this system.
1. Energy.
2. Financials.
3. Materials.
4. Information Technology.
5. Industrials.
6. Communication Services.
7. Consumer Discretionary.
8. Utilities.
9. Consumer Staples.
10. Real Estate.
11. Health care.
ICB was developed by FTSE Russel. It consists of 11 industries, 20 supersectors, 45 sectors, and 173 sub-sectors. The ICB industries include:
1. Energy.
2. Financials.
3. Basic Materials.
4. Information Technology.
5. Industrials.
6. Telecommunications.
7. Consumer Discretionary.
8. Utilities.
9. Consumer Staples.
10. Real Estate.
11. Health care.
TRBC was developed by Refinitiv. It consists of 14 economic sectors, 33 business sectors, 154 industries, and 898 sub-sectors. The TRBC economic sectors include:
Third-party industry classification schemes are instrumental in conducting in-depth analyses in various domains, such as developing indexes and evaluating investment performances. However, analysts often face a myriad of challenges when leveraging these schemes for detailed industry research.
1. Classifying Companies with Business Model Variations or that Sell Substitute Products
Analysts frequently encounter challenges with third-party classification schemes that tend to categorize companies either in overly broad or excessively narrow groups, driven by their perception of product similarities and business models. For instance, if an analyst wants to delve into the intricacies of e-commerce platforms, they might consider the “technology” sector too inclusive. This sector combines companies like Shopify, which specializes in offering commerce platforms, and Check Point Software, which focuses on cybersecurity solutions. These two companies have distinct focuses and don’t directly compete in the same market.
2. Grouping of Multi-product Companies
Since GICS, ICB, and TRBC are strict taxonomies, classification schemes tend to confine multi-product companies to a single category, which can complicate competitor analysis. A case in point is the cloud infrastructure sector, where an analyst might miss the competitive landscape between Microsoft’s Azure and Amazon’s AWS. Despite being formidable competitors in the cloud segment, their parent companies belong to different sectors, potentially leading to an oversight in competitive analysis.
3. Geographic Limitations in Classifications
The global scope of these classification schemes sometimes does not cater well to companies that have a significant presence on national or local scales. This issue arises mainly due to unique consumer behaviors or regulatory restrictions in different regions. For example, a healthcare provider operating predominantly in the UAE might find little merit in being compared with a global healthcare chain, given the stark differences in regulatory environments and consumer preferences in different regions.
4. Changes in Classifications over Time that affect Prior Period Comparability of Industry Statistics
Classification scheme providers may amend classifications over time, significantly impacting industry statistics. A prominent instance of this is the advent of the Real Estate sector, which primarily consists of Real Estate Investment Trusts. This shift caused a reclassification of companies from the Financial sector, considerably modifying the dynamics and performance indicators of both sectors.
Events in the market, like initial public offerings (IPOs) and de-listings due to acquisitions or bankruptcies, can alter the makeup of classification schemes. This can introduce survivorship bias when analyzing historical data. For example, if a company that consistently underperforms is removed from an index, it could artificially inflate the historical performance of that sector. This can lead to a distorted view of the industry’s performance over time.
To ensure reliable and accurate analysis, analysts should focus on updating historical data to align with the latest classifications. Moreover, efforts should be directed toward creating datasets that are free from survivorship bias. This practice helps prevent the derivation of misleading conclusions based on outdated or distorted data, thereby fostering a more realistic and insightful analysis.
Grouping companies is not limited to industry or product approach. Other methods are used in contexts such as index construction and investment performance evaluation. These include:
Companies are classified by country, and then countries are aggregated into categories such as developed, emerging, and frontier markets. For example, a company might be classified as a US company if it is incorporated in the US, even if it primarily serves the Chinese market.
The classification of developed, emerging, and frontier markets is more controversial, and third parties like index providers use greater discretion. It is not a quantitative determination but considers variables such as the size and liquidity of equity securities markets in the country, income per capita, and legal restrictions on foreign investment.
Companies are categorized as either “defensive” or “cyclical.” Defensive companies are those whose sales growth, profitability, and valuations are less influenced by changes in broad macroeconomic factors like GDP growth. In contrast, cyclicals are more sensitive to these changes. For instance, a utility company is considered defensive because people need electricity regardless of the economy, whereas a luxury goods company is seen as cyclical. After all, its sales might decline during a recession.
This categorization is achieved by grouping entire sectors from industry classification schemes. It’s possible to combine this approach with other methods, such as a geographic focus or credit ratings, to further refine exposure to specific risk factors.
Companies are grouped based on similarities of financial ratios and market data or co-movements of their securities’ investment returns. This approach includes grouping by size according to market capitalization or other characteristics such as valuation ratios, growth rates of sales or earnings, profitability ratios, and statistics based on price performance such as volatility and momentum. For example, small-cap growth companies might be grouped together based on their similar size and growth characteristics.
Companies are grouped based on ESG (Environmental, Social, and Governance) characteristics, such as the ratio of carbon emissions to revenues, board and executive personnel diversity measures, and exposure to certain businesses such as tobacco and gambling. These metrics can be aggregated into composite ESG ratings or scores that enable cross-issuer comparability.
These groupings are usually relative and tend to show far more turnover in their constituents than groupings based on industries and countries because these statistics are less stable by company, and companies’ rankings change. For example, a company might improve its ESG score by reducing its carbon emissions, moving it into a different grouping.
Question
Companies are often grouped based on ESG characteristics. Which of the following is most likely an example of an ESG characteristic?
- The ratio of carbon emissions to revenues.
- The ratio of sales to revenues.
- The ratio of employees to revenues.
The correct answer is A.
The ratio of carbon emissions to revenues is an example of an ESG (Environmental, Social, and Governance) characteristic. ESG characteristics are factors that investors consider alongside traditional financial measures to gauge a company’s performance and risk profile.
The environmental component of ESG refers to how a company’s operations impact the natural environment. This includes factors such as a company’s energy use, waste, pollution, natural resource conservation, and treatment of animals.
The ratio of carbon emissions to revenues is a measure of a company’s environmental impact, specifically its carbon footprint, relative to its size. This ratio can be used to compare the environmental performance of companies within the same industry or across different industries. A lower ratio indicates a company that is more efficient in its use of resources and has a smaller environmental impact relative to its revenues.
B is incorrect. The ratio of sales to revenues is not an ESG characteristic. This ratio is typically equal to one, as sales are a component of revenues. It does not provide any information about a company’s environmental, social, or governance practices.
C is incorrect. The ratio of employees to revenues is not typically considered an ESG characteristic. While it may provide some information about a company’s efficiency or labor intensity, it does not directly relate to the company’s environmental, social, or governance practices. However, other employee-related metrics, such as diversity and inclusion measures or worker safety statistics, could be considered ESG characteristics.
Access CFA study notes, practice questions, mock exams, and video lessons to strengthen your understanding of industry classification and company grouping methods.


Get Ahead on Your Study Prep This Cyber Monday! Save 35% on all CFA® and FRM® Unlimited Packages. Use code CYBERMONDAY at checkout. Offer ends Dec 1st.