Economic Growth, Inflation, Interest a ...
Marginal revenue (MR) and marginal cost (MC) affect how a company makes its production decisions. Marginal cost (MC) refers to the increase in cost that is occasioned by the production of an extra unit. It is the additional cost of producing an additional unit.
Marginal revenue (MR) refers to the extra profit made by producing or selling an extra unit.
We’ll start with the perfect competition here because it is the easiest to understand. In perfect competition, each firm produces at a point where price (P) equals marginal revenue (MR) and average revenue (AR). As seen before, each firm does not make any economic profit in the long run. The quantity produced by each firm is also the point where the average cost (AC) equals marginal cost (MC).
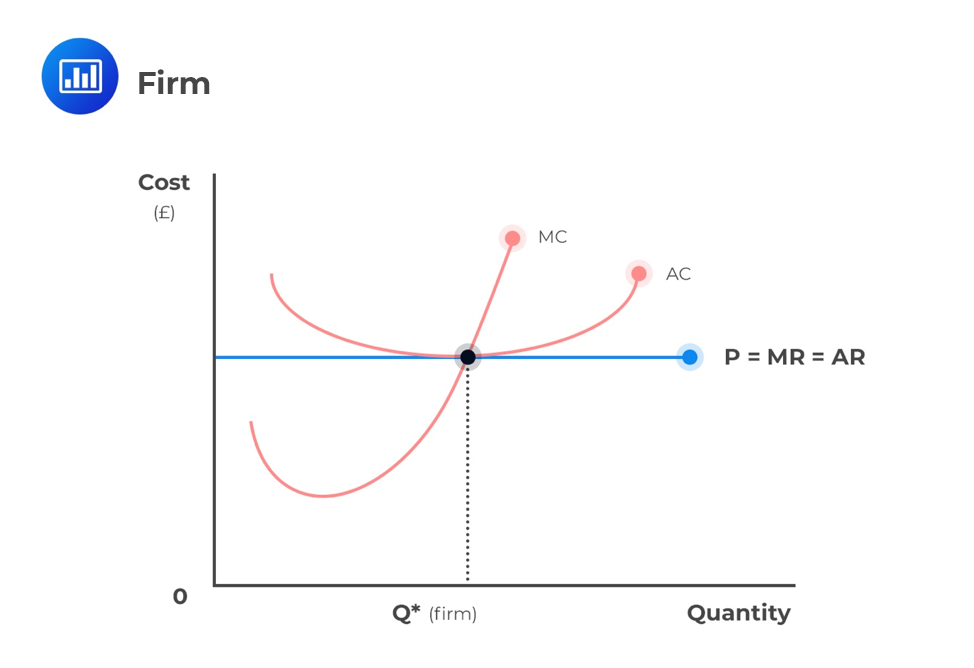
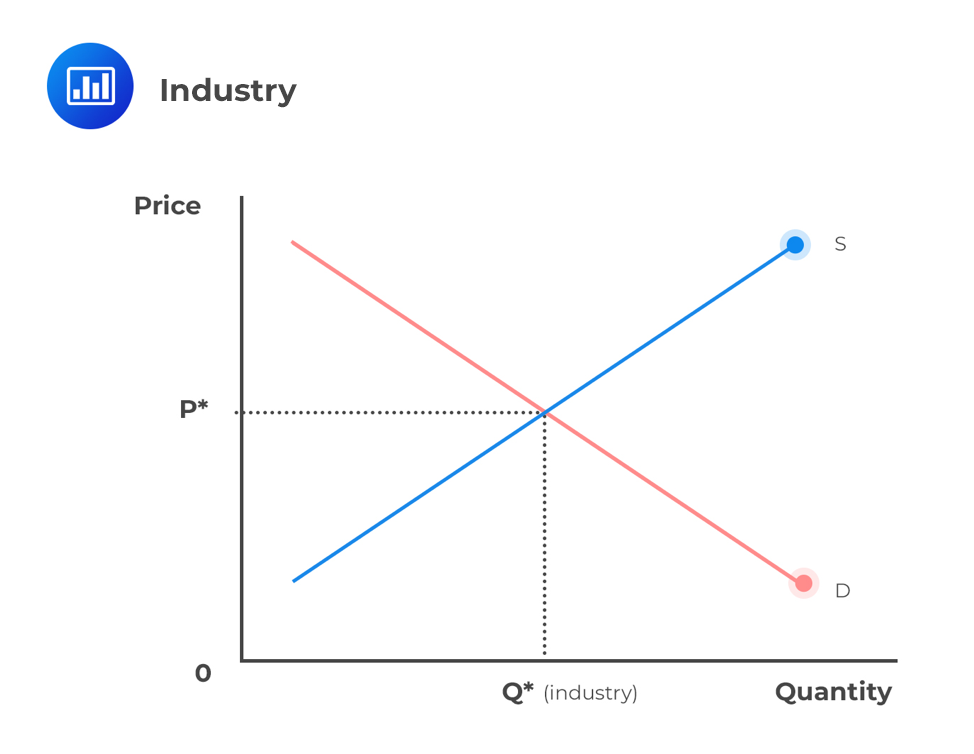
In a competitive market, individual buyers and sellers represent a very small share of total transactions made in the market. Therefore, they do not influence the prices of their products. Any individual firm is a price taker, and it is the market forces of demand and supply that determine the price.
In perfect competition, total revenue (TR) is equal to price times quantity for any given demand function. Mathematically it is represented as TR = P×Q.
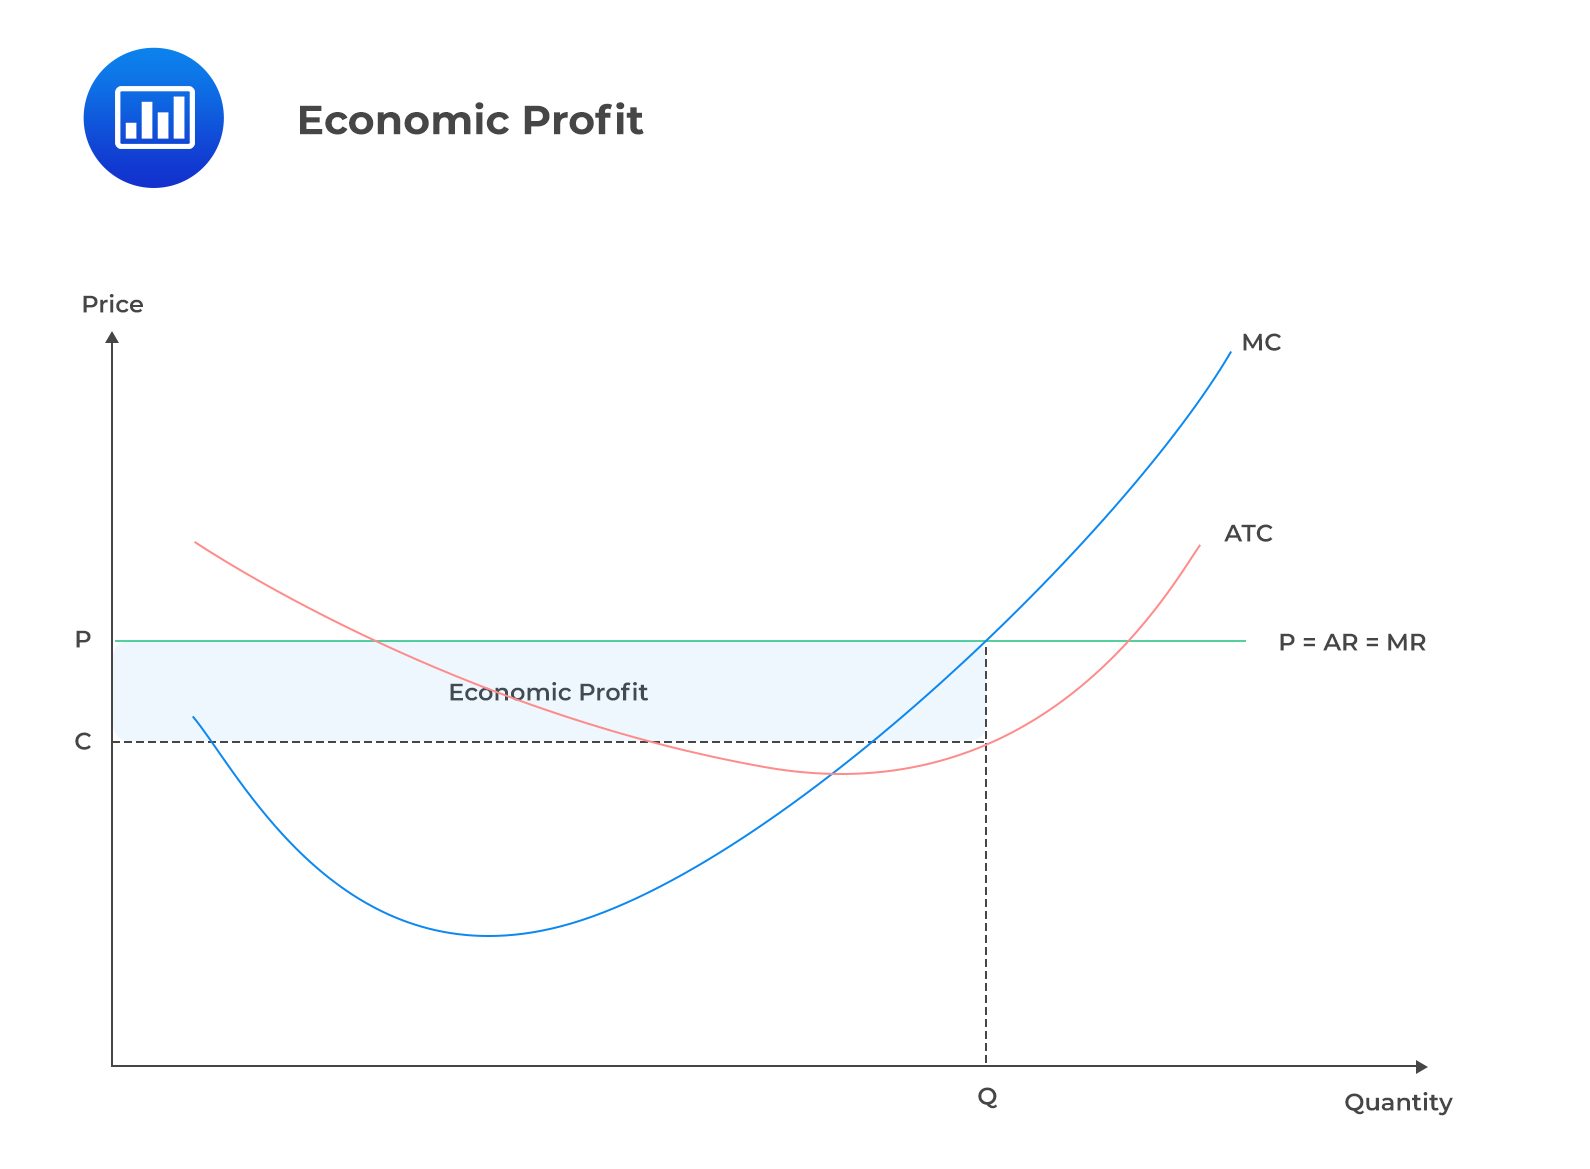
Each firm in a perfect competition does not make any economic profit in the long run; however, profit-maximizing firms will maximize profits when they produce Q quantities when MC=MR. The quantity produced by each firm is also the point where the average total cost (ATC) equals marginal cost (MC). Economic profit is maximized at the point at which marginal revenue (MR)=marginal cost(MC) in the short run, as indicated in the graph below.
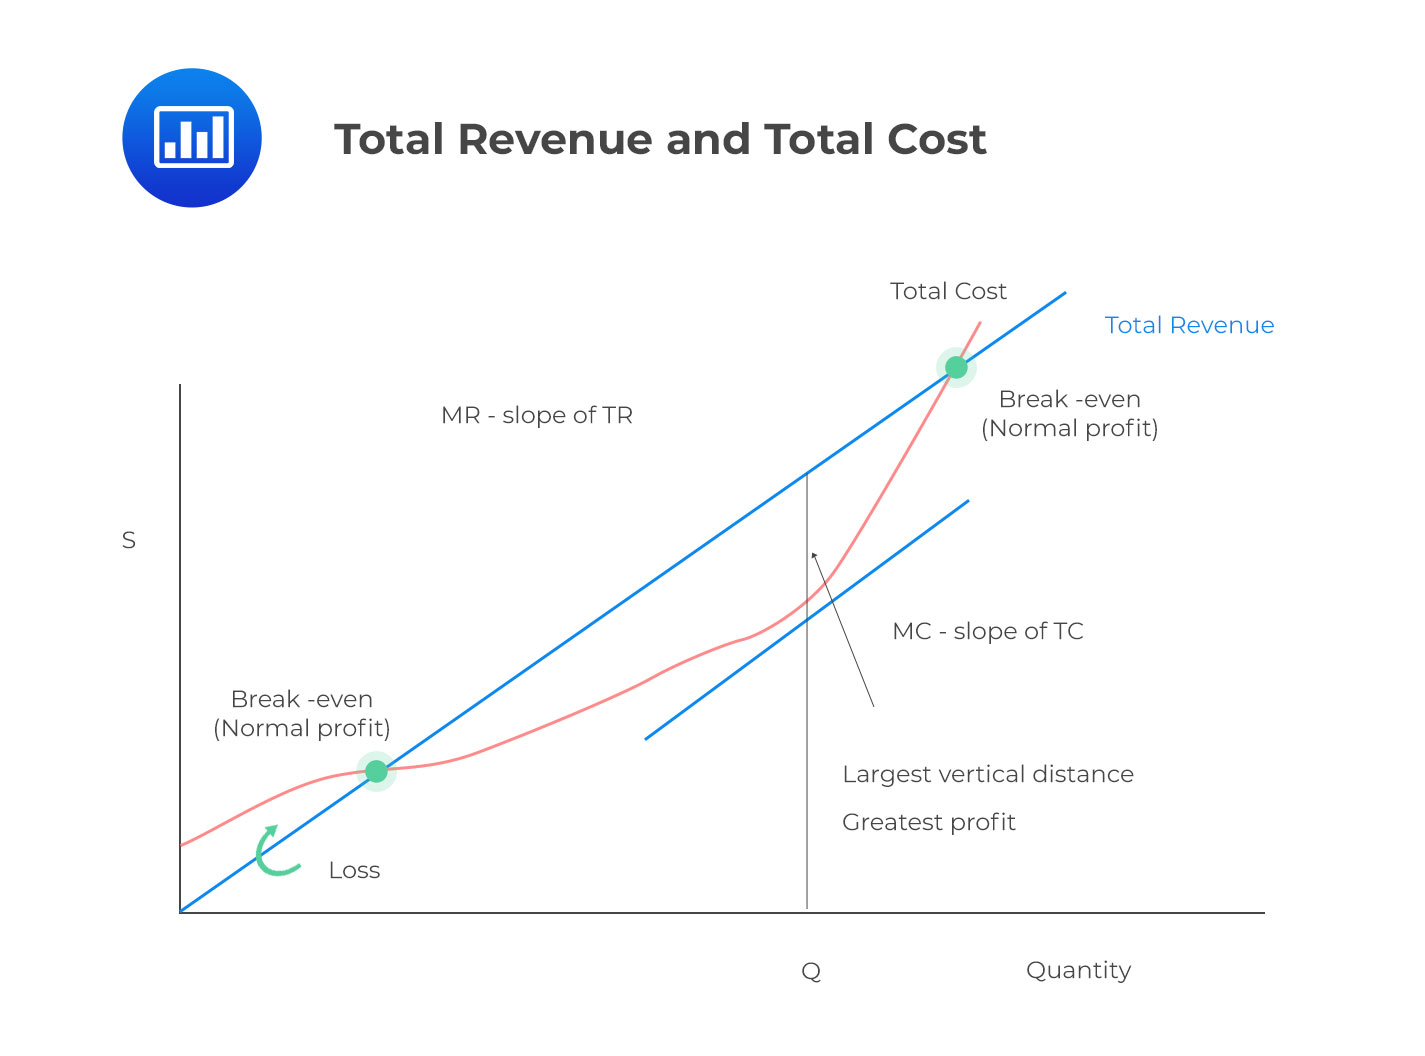
It’s important to note that the profit maximization process occurs when total revenue (TR) exceeds total costs (TC) by a maximum amount, as shown below.
In a perfectly competitive market, individual buyers and sellers represent a very small share of total transactions made in the market. Therefore, they do not influence the prices of their products. Any individual firm is a price taker, and it is the market forces of demand and supply that determine the price resulting in a perfectly elastic demand as shown below;
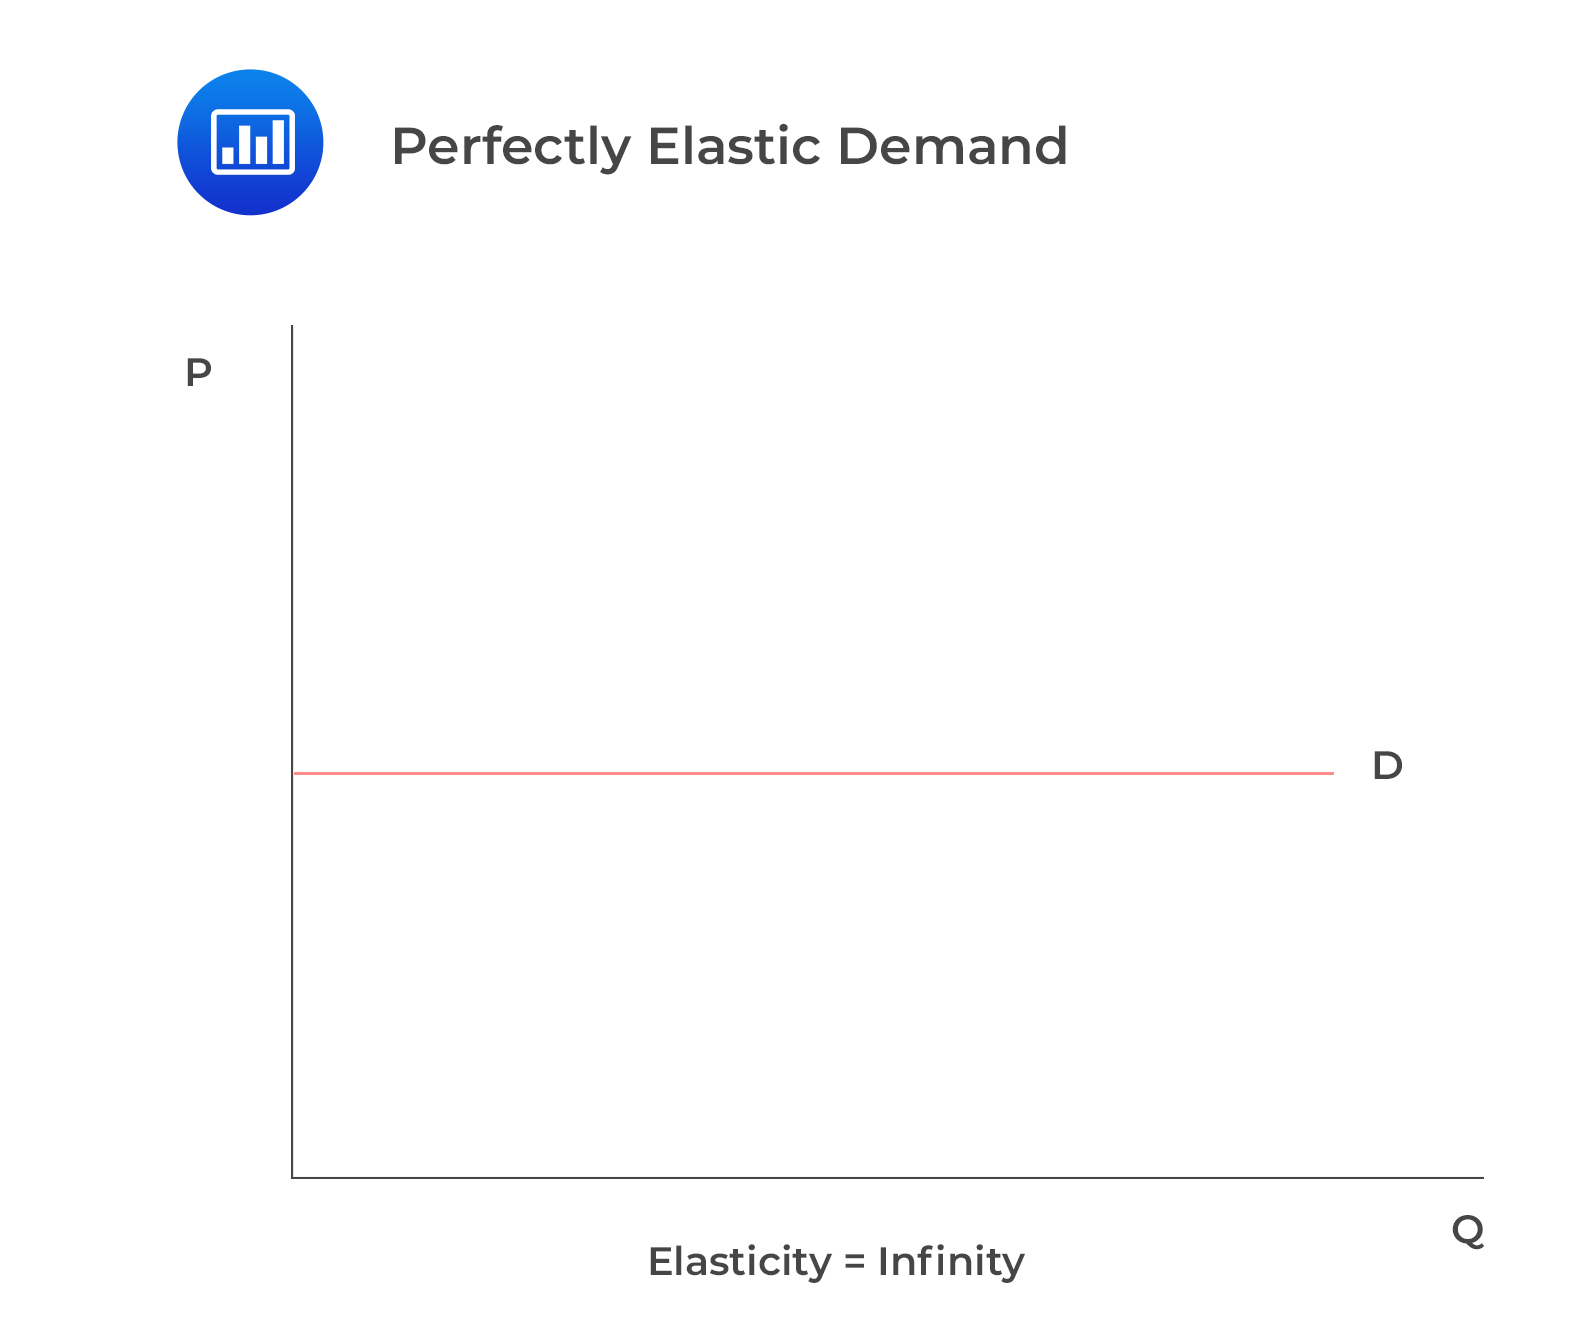
The relationship between change in prices and change in quantities demanded is referred to as price elasticity. Total revenue is maximized when marginal revenue is zero; hence total revenue will only decrease when marginal revenue becomes zero. Therefore, the elasticity of demand in this regard shows that the percentage decrease in price is greater than the percentage increase in quantity demanded.
Goods produced under monopolistic competition are differentiated from one another by branding. It means that these firms have some control over their prices. However, raising these prices may cause some customers to shift to other products considered close substitutes. As a result, demand for these products will fall.
If a firm lowers the prices of its products, buyers will shift from buying other products and start buying its products. Consequently, the demand for the products will rise.
Generally, a firm under monopolistic competition can best be described by its elasticity (responsiveness) to demand. When demand is high, it increases the price of goods to maximize profit. It creates some supernormal profit, as seen in the graph below.
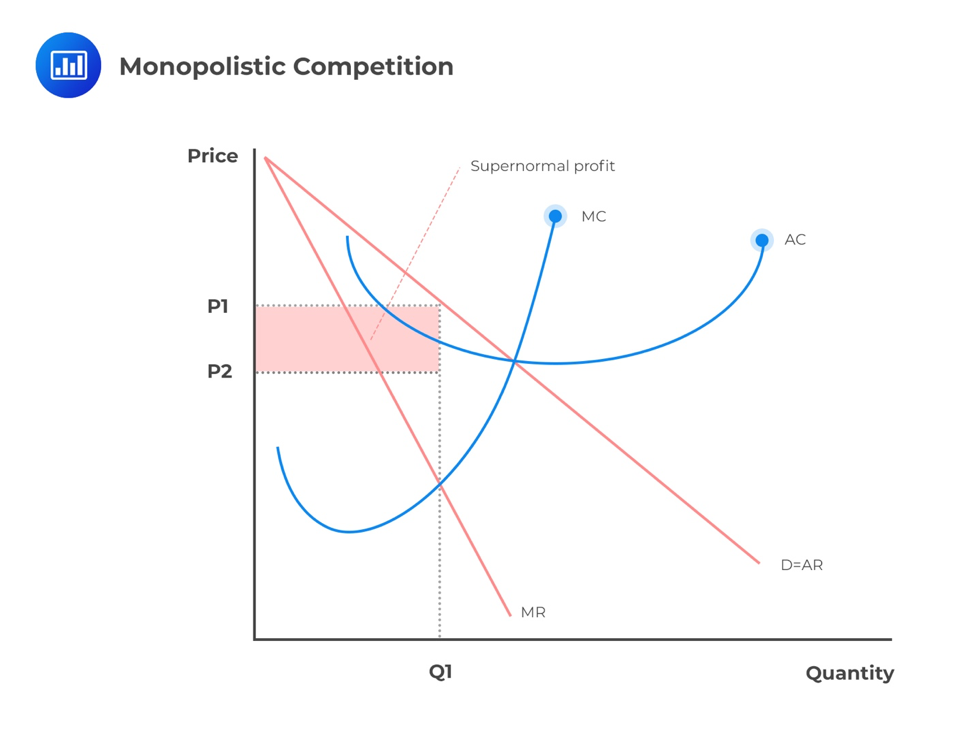
A firm will likely maximize its profits if its marginal cost (MC) equals its marginal revenue (MR), as shown in the graph, and it will earn an economic profit when the price P1 is above the average cost C1.
On the other hand, when demand is low, the firm will lower its prices to win more customers. In the long run, other firms can also enter the market and compete to eliminate the supernormal profits. As a result, the profits of the monopolistic competitive firm will be normalized.
Firms under this market structure are assumed to generally work towards the protection and maintenance of their share of the market. In other words, all firms may match one another’s prices. If one of the businesses raises its price, then a large substitution effect takes place. As a result, demand becomes relatively elastic.
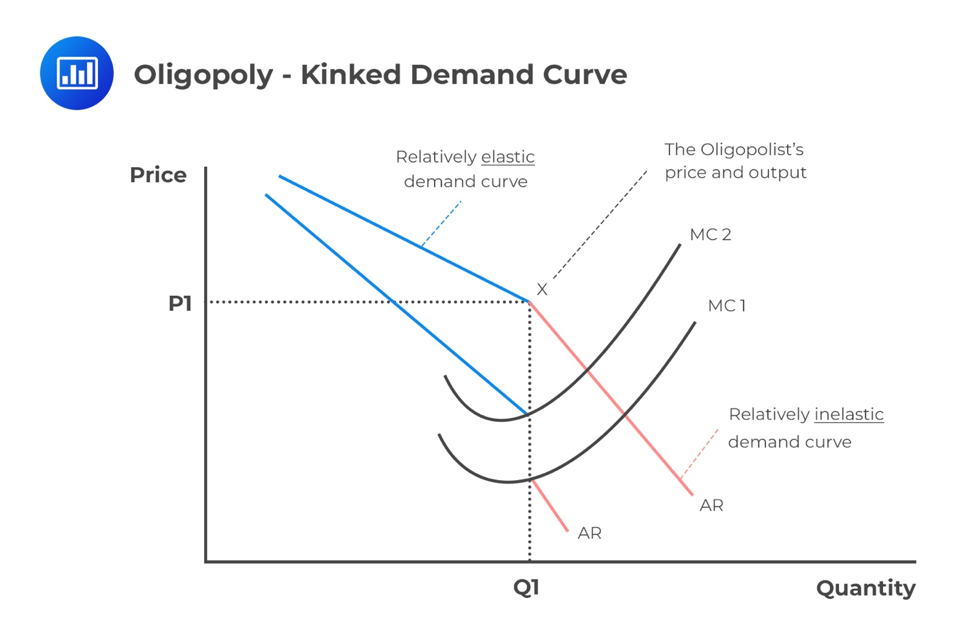
From the above graph, the kink price is at P1 when the firm produces Q1. The firm anticipates that if the prices go above P1, the market competitors will maintain the prices at P1, resulting in a loss of market share.
Above P1, the demand curve is relatively elastic, i.e., an increase in price leads to a huge decrease in demand, while below P1, competitors will match the reduced prices, and therefore, the firm will maximize its profits at Q1.
The marginal revenue associated with each demand structure also differs in the oligopoly, and each is synonymous with a different part of the kinked demand curve.
The level of output that maximizes profit occurs where marginal revenue (MR) is equal to marginal cost (MC), that is, MR=MC as indicated in the graph above.
Since only one firm controls the whole market for a monopoly, the demand curve will be the average revenue curve (AR=D). The quantity that the monopolist will produce is when marginal revenue equals marginal cost (MR=MC), just like in perfect competition, the profit-maximizing output.
However, since the marginal and average revenue curves are separate, the monopolist will charge the price PM at the top as illustrated in the graph below;
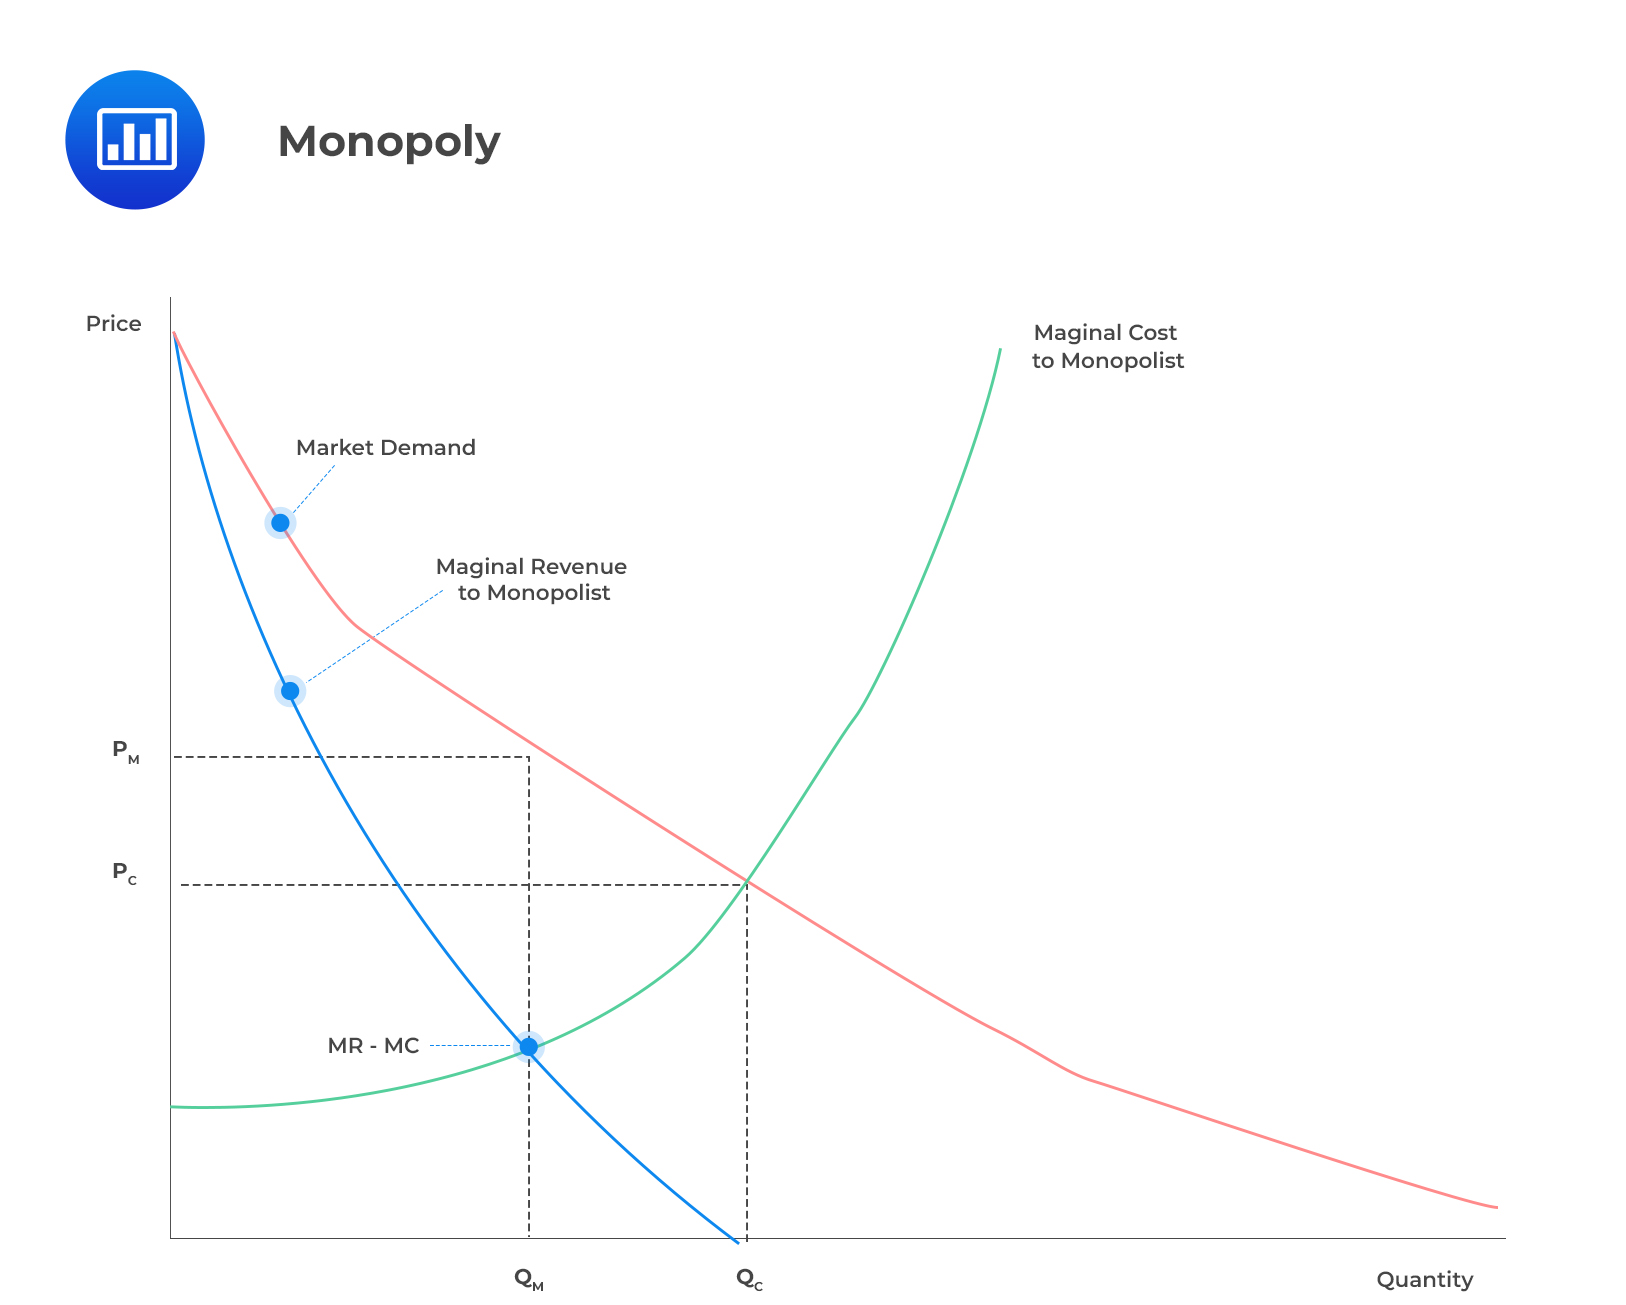
Since the monopolist produces QC but charges the price PC, this creates a “box” of supernormal profit from PM to PC and QM to QC.
In this form of market, the demand is relatively inelastic. It means that consumers buy about the same amount whether the price drops or rises. The monopolist needs to lower their prices by offering bundles or discounts to produce more.
Question
Over time, the market share of a dominant oligopoly firm:
- increases.
- decreases.
- remains constant.
Solution
The correct answer is B.
Over time, the profits made by the dominant oligopoly firm will attract more investors or companies to the industry. Therefore, the market share of the dominant firm will decrease.
Practice price‑output & elasticity problems with full answers.
Get Ahead on Your Study Prep This Cyber Monday! Save 35% on all CFA® and FRM® Unlimited Packages. Use code CYBERMONDAY at checkout. Offer ends Dec 1st.