


Aggregate Supply
[vsw id=”XDs9kjMPKTo” source=”youtube” width=”611″ height=”344″ autoplay=”no”] Aggregate supply refers to the total amount... Read More

An oligopoly is a market structure in which a small number of large firms dominate an industry. Because only a few firms compete, each company’s pricing and production decisions directly influence its competitors, making strategic decision-making a defining feature of oligopoly markets.
Unlike perfect competition, firms in an oligopoly possess some market power and often face significant barriers to entry. Businesses may compete through prices, product differentiation, advertising, innovation, or customer service while closely monitoring the actions of rival firms.
Examples of oligopoly markets include the airline industry, smartphone manufacturers, automobile companies, and commercial airlines, where only a handful of firms control a large share of the market.
In this study note, you’ll learn:
Several features distinguish oligopoly markets from other market structures.
Key characteristics include:
Because firms closely monitor competitors, one firm’s pricing decision often triggers immediate responses from others.
Several industries demonstrate the characteristics of oligopoly competition.
Examples include:
For example, when one airline lowers ticket prices on a popular route, competing airlines often respond quickly by adjusting their own prices. This strategic interdependence illustrates why firms in oligopoly markets continuously monitor competitors’ actions.
The demand curves in oligopoly markets are influenced by the level of pricing interdependence among firms. When collusion exists in a market, the aggregate market demand curve is divided among the individual producers. In the absence of collusion, each firm faces its own demand curve.
Additionally, the demand characteristics in non-colluding oligopoly markets are shaped by the pricing strategies employed by the participating firms.
There are three primary pricing strategies used in the oligopoly market: Pricing interdependence, the Cournot assumption, and the Nash equilibrium.
The price interdependence strategy assumes that there is pricing interdependence among the firms in an oligopoly market structure. This strategy assumes that competitors will lower prices to keep their customers and avoid raising prices to lure customers away from rivals.
The idea is that by matching a competitor’s lower price, the company will maintain its customers and avoid a decrease in demand. On the other hand, by not raising prices like their competitors, firms pull in customers from their rivals.
For any given price, the price elasticity of demand will be more when prices increase and less when prices decrease since customers are more responsive to a price increase (as they can buy for less from competitor firms) and less responsive to price decreases (because competitors will match the price decrease)
As a result, there are two different demand structures:
Note that each demand curve will have its own marginal revenue. Denote the demand and marginal revenue curve by DP ↑ and MRP↑ when the price increases and by DP ↓ and MRP↓ when the prices fall. Consider the following diagram:
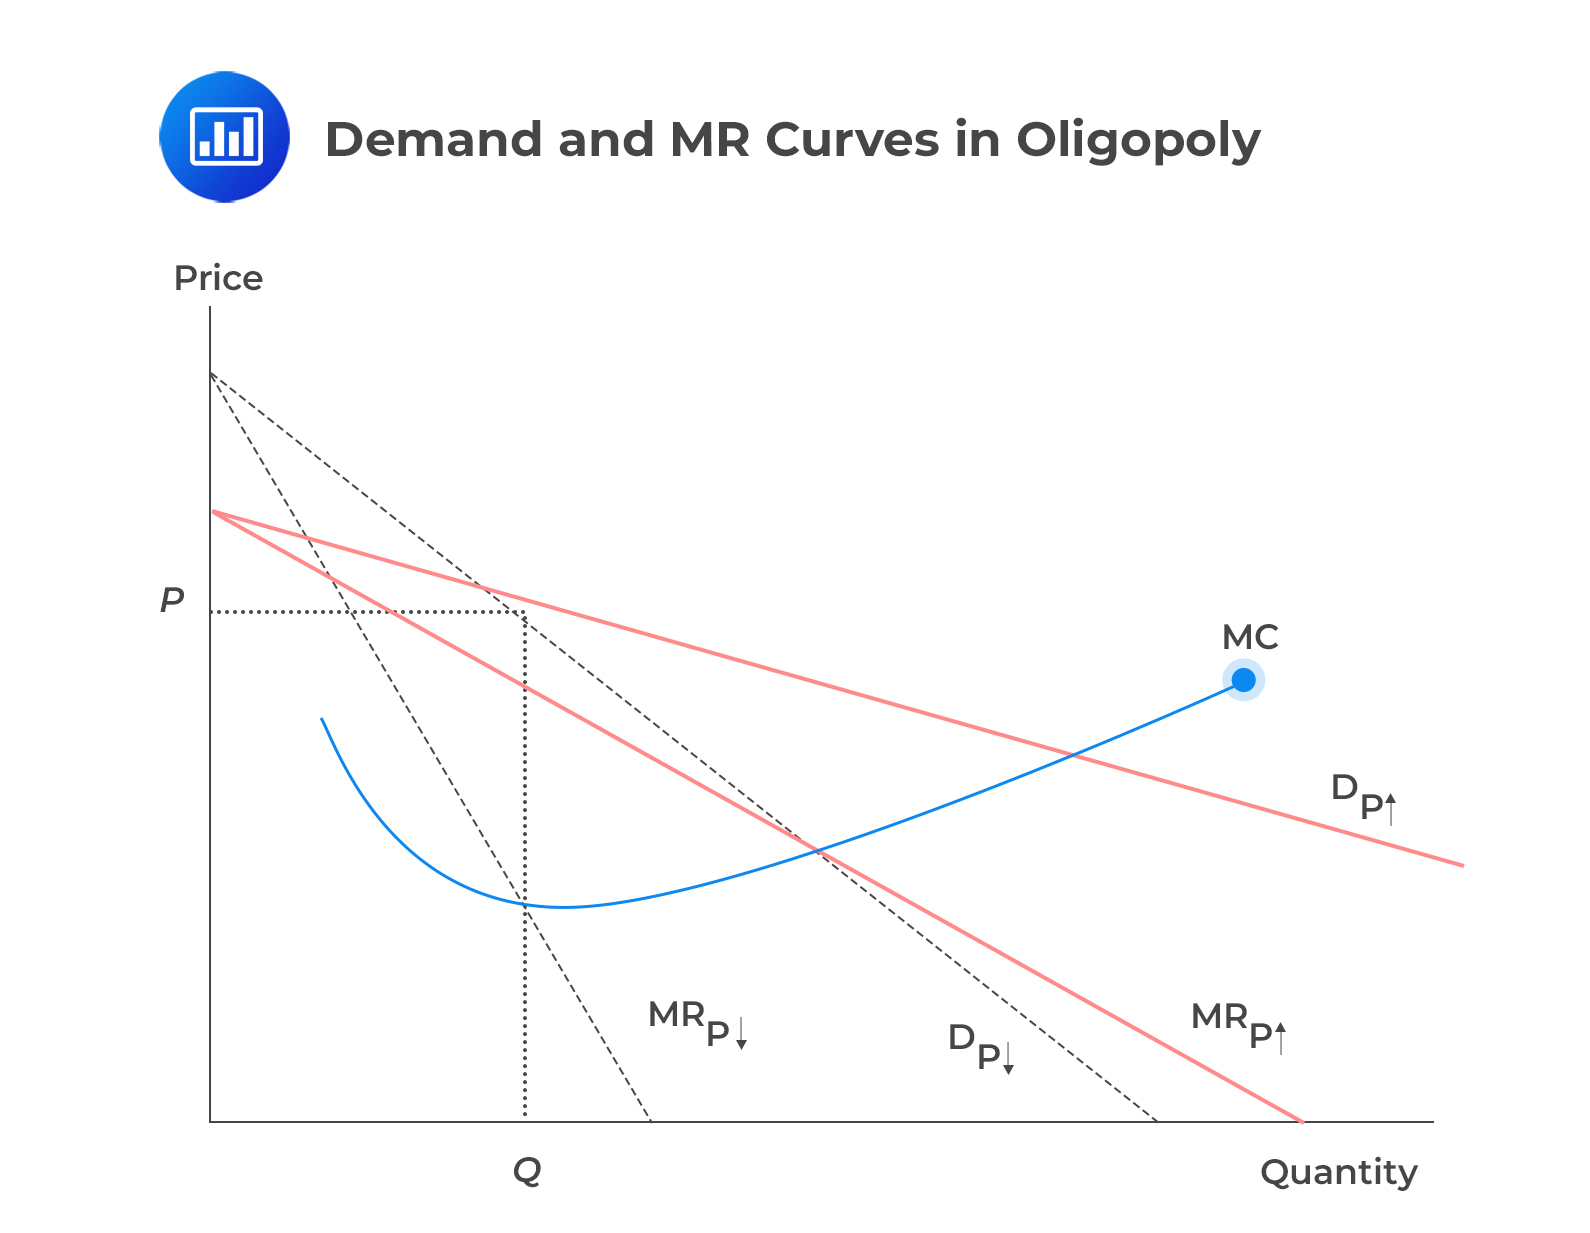
From the above diagram, the overall demand can be seen as \(D=D_{P\uparrow}+D_{P\downarrow}\). This oligopolistic pricing strategy leads to a kinked demand curve, where the two segments represent distinct competitor reactions to price changes. The kink in the demand curve creates two parts in the marginal revenue structure. One part is connected to price increases, and the other is related to price decreases.
Observe the following kinked demand curve in the Oligopoly market:
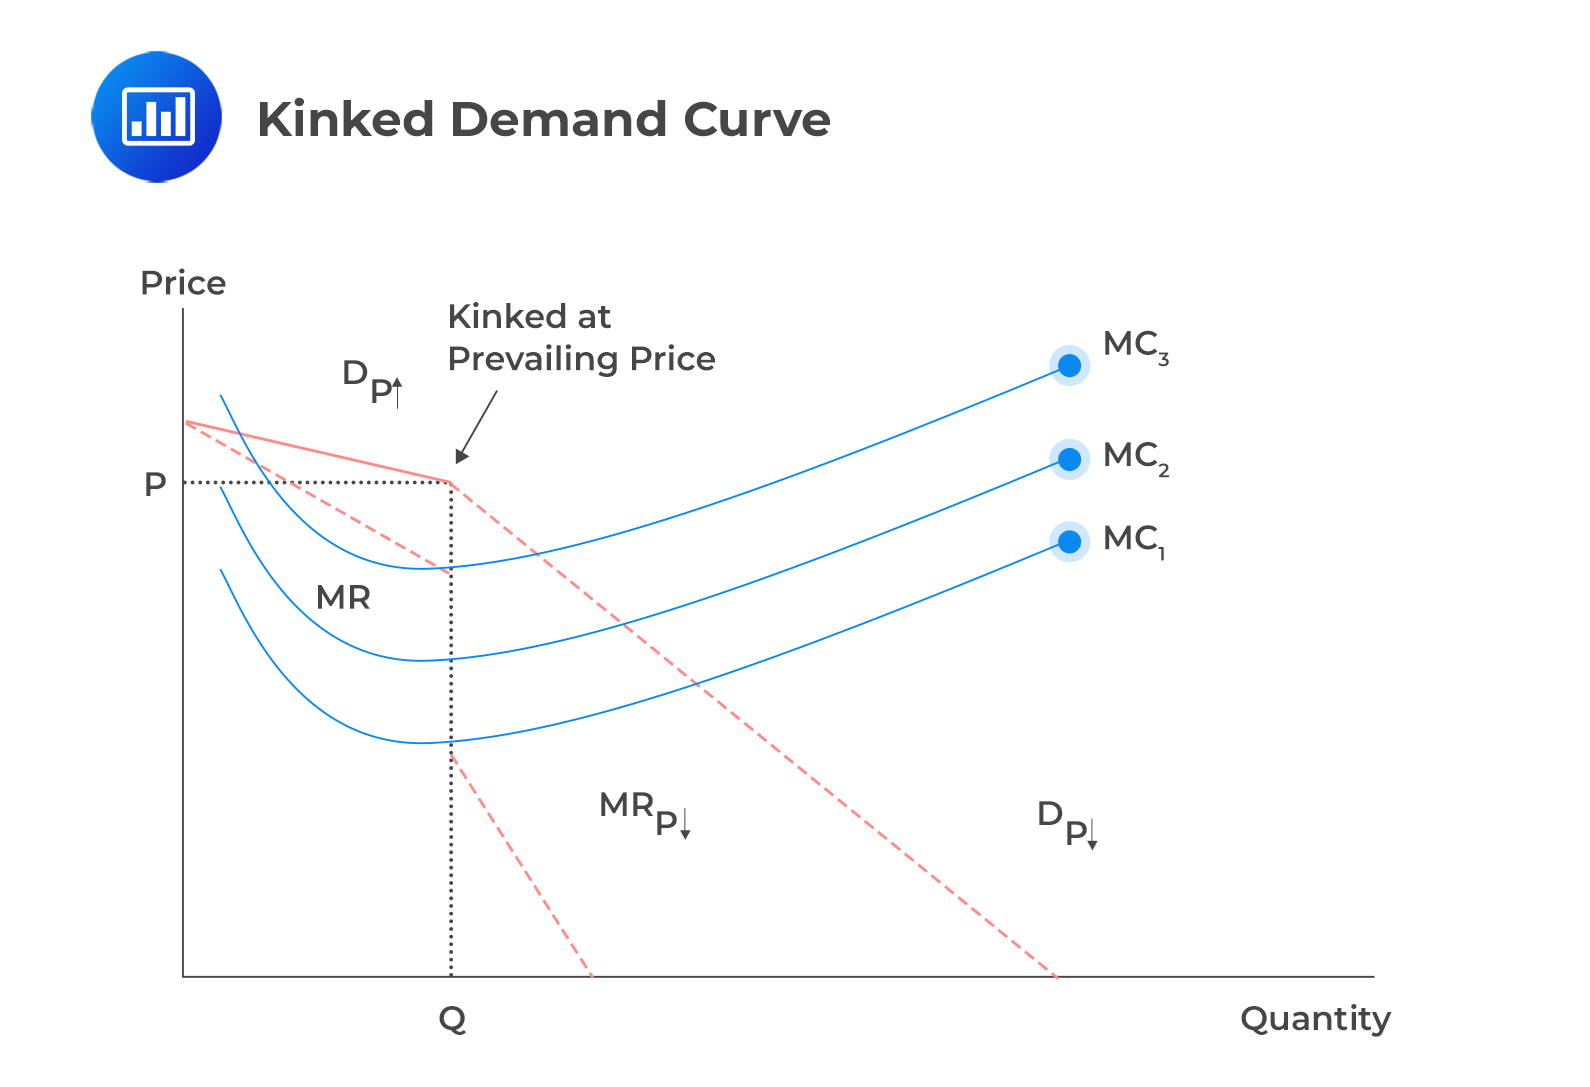
If the company has low marginal costs, labeled as MC1, the earlier rule of setting marginal revenue (MR) equal to marginal cost (MC) remains true even in an oligopoly. The marginal cost can increase to MC2 and MC3 before affecting the firm’s profit. If the MC2 curve passes through the gap in the marginal revenue, the best price-output combo stays the same at the current price and original output level.
Economists use several models to explain how firms behave in oligopoly markets.
| Model | Main Idea |
| Kinked Demand Curve | Prices tend to remain stable because competitors respond differently to price increases and decreases. |
| Cournot Model | Firms compete by choosing output levels while assuming competitors keep production constant. |
| Nash Equilibrium | Each firm chooses its best strategy given the expected actions of rivals. |
| Stackelberg Model | One firm acts as the market leader while competitors respond as followers. |
Understanding these models helps explain why firms in oligopolies often avoid aggressive price competition.
Under the Cournot assumption, each firm determines its optimal production level while assuming that the output of other firms will remain unaltered. The goal of firms under the Cournot assumption is to maximize profits while expecting the other firms to maintain a constant output in the future.
Cournot assumption makes pricing strategy easier as there’s no need to predict a competitor’s response. It offers a practical way to study actions in oligopoly markets. Consider the simplest oligopoly scenario: a duopoly with two firms. When in equilibrium, neither wishes to alter production based on the other’s output. Each company tries to maximize profits, thinking the other will maintain its current production level.
The Cournot strategy approach is believed to persist until both firms reach their long-run equilibrium. In this equilibrium, both output and price stabilize, and no changes in price or output can result in increased profits for either firm.
The Nash equilibrium occurs when participants in a non-cooperative market choose strategies and stick to them, even after considering their opponents’ strategies.
In oligopoly markets, the Nash equilibrium is characterized by the fact that no firm in the oligopoly can increase its profits by unilaterally altering its pricing strategy. The basic assumption is that each participating firm does the best it can, considering the reactions of its rivals.
In other words, each firm expects the other firms to respond to any change made by competitors by doing their best under the changed circumstances.
In the oligopoly market, firms’ actions are interdependent and non-corporative, with each firm making decisions that maximize its own profits. In other words, the firms do not collude. Equilibrium is achieved when all firms are striving to do their best in their interest, considering the actions of their rivals.
Consider a duopoly with companies A and B. Both companies can charge e high or low prices for their products. The following table gives the amount of profits each company receives if it charges a high or low price:
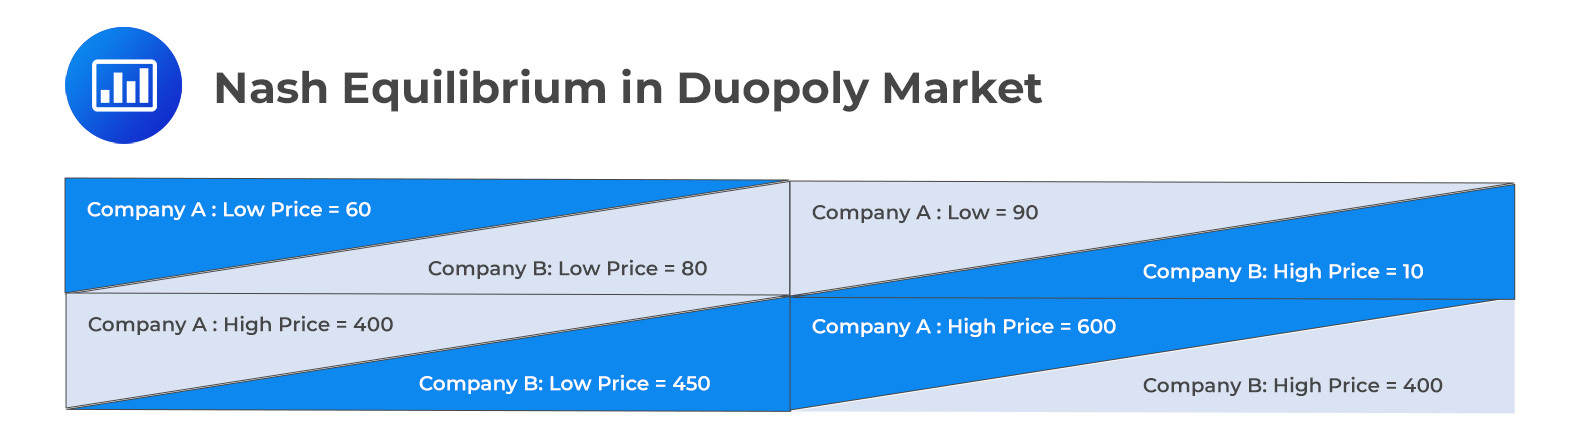
The interpretation of the table is as follows: Consider the top left corner cell. The cell shows that when both companies offer the product at low prices, company A earns a profit of 60, and company B earns 80.
It is easy to see that both companies earn a maximum combined profits of 1,000 if both companies charge high prices.
Recall that according to Nash equilibrium, each firm behaves in its own best interest. In our case above, company B can improve its position by charging low prices when company A charges high prices. Specifically, in the lower left cell, company B earns a profit of 450 when company A charges a high price of 400.
Notice that company A can earn a maximum profit of 600 only if company B agrees to charge a high price. However, this is not in Company B’s best interest because it can still earn a profit of 450 by charging lower prices.
The conditions in oligopolistic industries promote collusion as there are only a few competitors, and their pricing behavior is interdependent. Collusion is motivated by several factors, such as the potential for increased profits, the desire to reduce uncertainty in cash flow, and the opportunity to create barriers that discourage new entrants.
When firms openly and formally establish collusive agreements, they form a cartel. Six factors significantly influence the chances of successful collusion:
In oligopolistic markets, another notable decision-making strategy is the first-mover advantage in the Stackelberg model. This model assumes sequential decision-making, where the leader firm selects its output first, and then the follower firm chooses after observing the leader’s output. The leader firm gains an advantage by being the first mover in this scenario.
Although collusion can increase profits, maintaining it is often challenging.
Firms may secretly lower prices to gain market share while benefiting from competitors maintaining higher prices. Governments also regulate collusion because it reduces competition and may harm consumers through higher prices and reduced choice.
As a result, many countries prohibit explicit price-fixing agreements.
Just like in monopolistic competition, the oligopoly market structure lacks a well-defined supply function. It’s impossible to ascertain the oligopolist’s best output and price without considering the demand conditions and competitors’ moves. However, the oligopolist possesses a cost function that determines the optimal supply level. Thus, the profit-maximizing rule holds true: The output level maximizing profit occurs where MR = MC, and the price is determined by the price consumers are willing to pay for that quantity of the product.
Therefore, the equilibrium price results from the demand curve, while the output levels result from the association between the MR and the MC.
A dominant firm (one that controls at least 40% market share) in an oligopoly market is one that has greater capacity, a lower cost structure, is a pioneer in the market, or has secured greater customer loyalty. As such, the dominant firm becomes the price maker with similar powers as monopolists.
The other firms in the market follow the pricing strategies of the dominant firm. The followers cannot undermine the dominant firm because it often enjoys a lower cost of production. Surprisingly, the price followers would rather charge a higher price than the dominant firms’ price. If they try to charge lower prices than the dominant firm, they will get themselves into price wars with a lower-cost producer who can threaten their survival
There is no optimum price and output analysis that applies to all oligopoly market scenarios. The interdependence of the few firms in an oligopoly leads to an intricate range of pricing options, which vary based on the specific market conditions.
For instance, in a kinked demand curve, the optimum price is the prevailing price at the kink on the demand function. However, when a dominant firm exists, the optimum price is determined at a point where MR = MC. The profit-maximizing price is then based on the output position of the part of the demand function faced by the dominant firm.
In the Cournot assumption, each firm assumes that the other firms will be indifferent to a dominant firm’s choice of price and output level. The optimum price is then again determined at the output level where MR = MC.
In the case of the Nash equilibrium, each firm reacts to its circumstances, maximizing its profits.
Due to the interdependence in an oligopoly market structure, an individual firm’s price and output level remains uncertain.
In the long run, there is a possibility for economic profits in oligopoly markets. History has shown that the market share of a dominant firm will decline in the long run. As is always the case, profits will attract more firms to enter the oligopoly market.
Over time, marginal costs incurred by entrant firms fall due to the adoption of more efficient production methods. The demand and marginal revenue of the dominant firm will decrease, reducing its profitability.
Some firms may decide to incorporate innovation (even though it may be uneconomical at times) to maintain market leadership. Generally, an optimal pricing strategy, in the long run, should incorporate the reactions of rival firms to changes in prices.
Candidates are frequently asked to distinguish between the different oligopoly models.
Remember:
Knowing the assumptions behind each model is often more important than memorizing every diagram.
Question
Which of the following is a factor that influences the chances of a successful collusion?
- Similarity in cost structures.
- Differentiated Products
- Infrequent, large order sizes.
Solution
The correct answer is A.
Successful collusion is more probable when the participating firms have similar cost structures.
B is incorrect. Collusion is more likely to succeed in markets with homogeneous/similar products.
C is incorrect. Collusion is more likely to be successful when orders are frequent, regular, and of relatively small sizes.
Oligopoly vs Other Market Structures
Feature Oligopoly Monopolistic Competition Perfect Competition Monopoly Number of Firms Few Many Many One Product Differentiation Sometimes Yes No No close substitutes Pricing Power Moderate Moderate None High Entry Barriers High Low Very Low Very High Long-Run Economic Profit Possible Zero Zero Possible This comparison highlights why oligopoly occupies the middle ground between monopoly and competitive markets.
Frequently Asked Questions
What is an oligopoly?
An oligopoly is a market structure dominated by a small number of firms whose decisions influence one another.
What are examples of oligopoly?
Examples include airlines, automobile manufacturers, smartphone companies, telecommunications providers, and soft drink producers.
Why are firms interdependent in an oligopoly?
Because only a few firms compete, one firm’s pricing or production decision affects the profits and strategies of competitors.
What is the Cournot model?
The Cournot model assumes firms choose production quantities while expecting competitors to keep output constant.
What is Nash equilibrium?
A Nash equilibrium occurs when each firm’s strategy is optimal given the strategies chosen by competitors.
Why do firms collude?
Firms may collude to increase profits, reduce uncertainty, or discourage new competitors from entering the market.
What is the kinked demand curve?
The kinked demand curve explains why prices often remain stable in oligopoly markets because competitors react differently to price increases than price decreases.
Why Oligopoly Competition Matters in CFA Level I
Oligopoly competition is an important CFA Level I Economics concept. Candidates may be tested on how firms behave when only a few competitors dominate a market, including pricing interdependence, game theory outcomes, and barriers to entry.
To strengthen your preparation, explore the CFA Level I study program with practice questions, mock exams, and guided lessons.
Practice pricing strategies, analyze firm behavior, and apply economic concepts to exam-style questions.


Get Ahead on Your Study Prep This Cyber Monday! Save 35% on all CFA® and FRM® Unlimited Packages. Use code CYBERMONDAY at checkout. Offer ends Dec 1st.