


Financial Leverage, Net Income, and ROE
Financial leverage is the extent to which a company finances its operations using... Read More

A company’s business operations typically consist of a series of consecutive stages. For example, consider a manufacturing company whose operating cycle includes the purchase of raw materials, inventory production, sale to customers, and debt collection, as shown below:
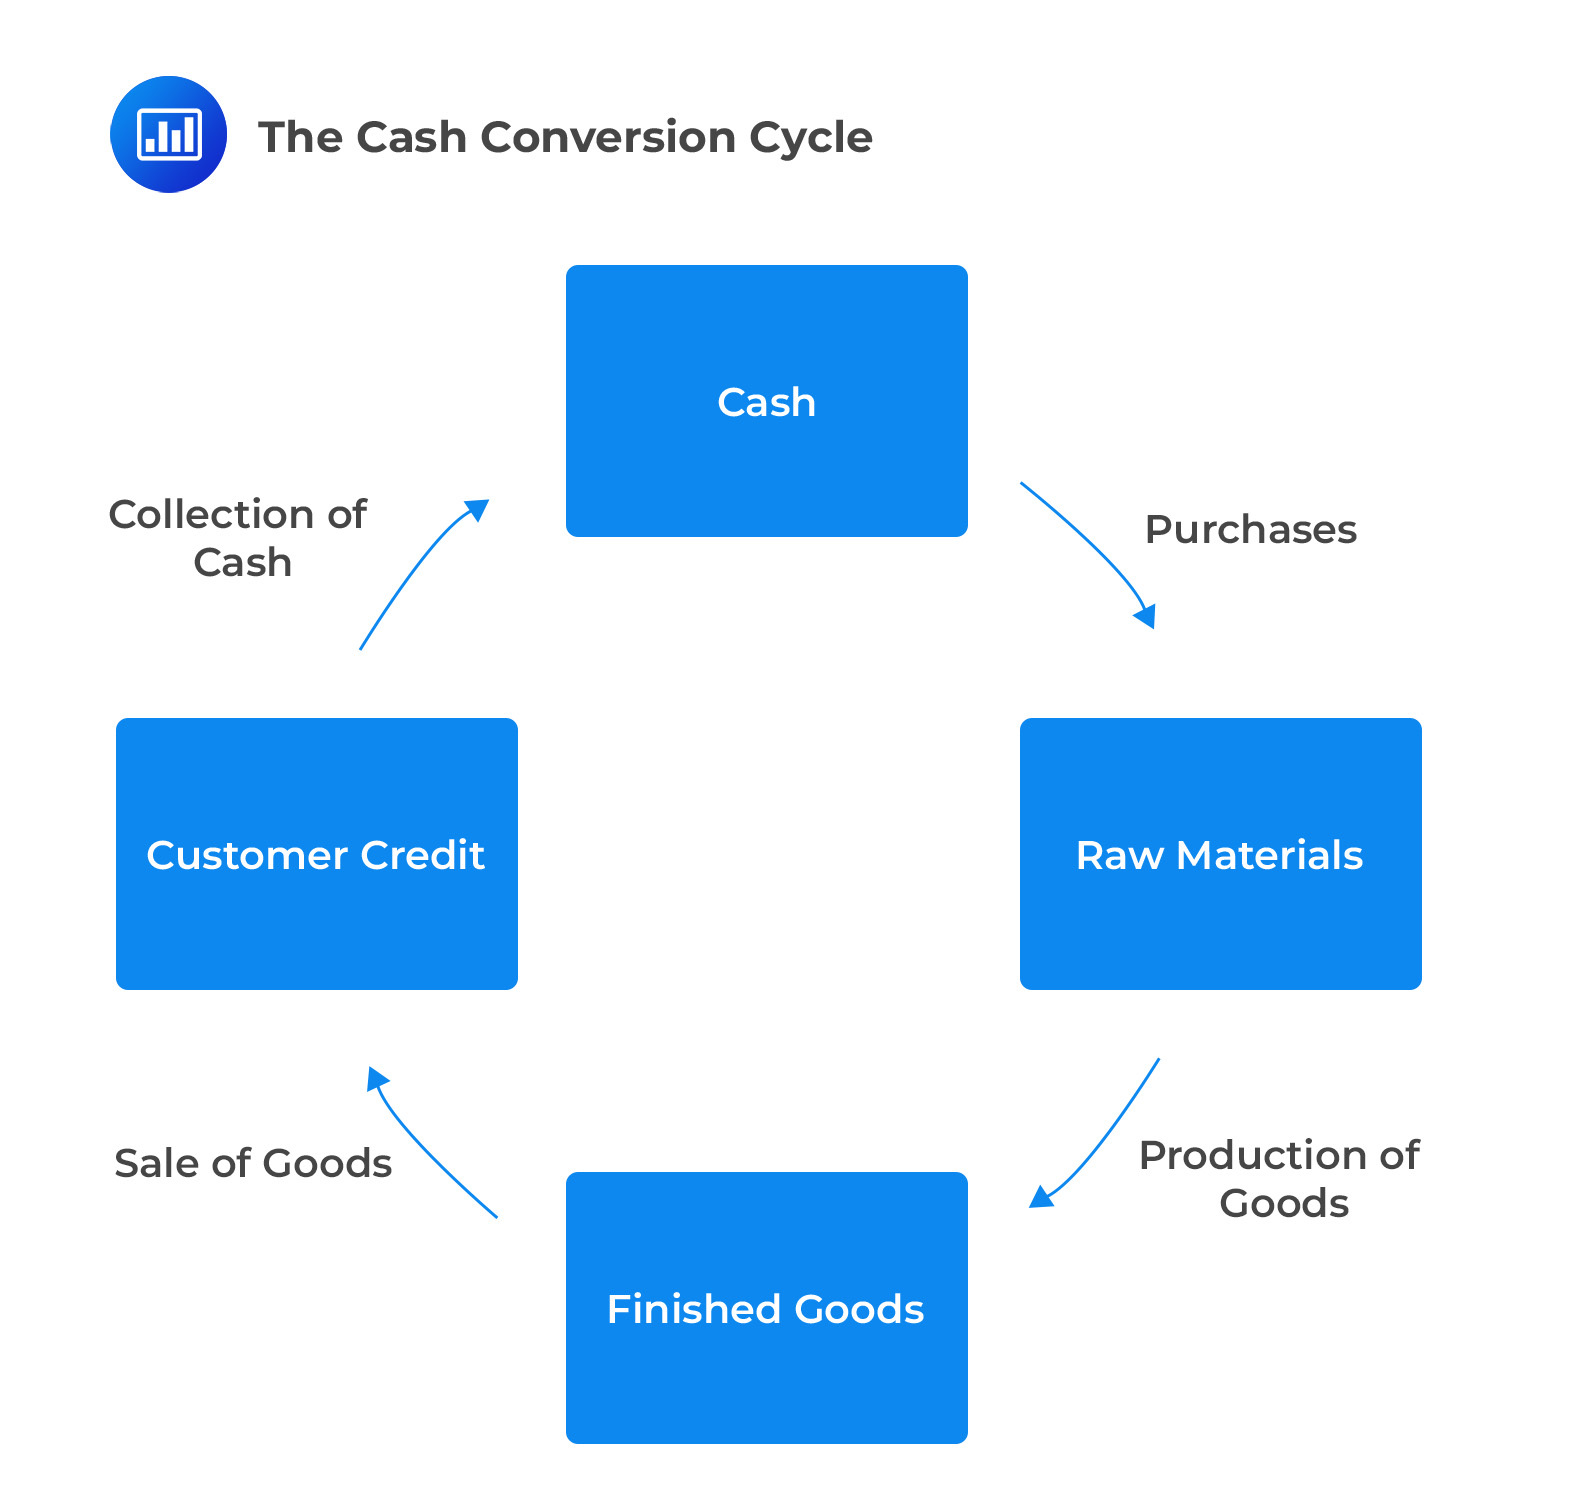
A company’s operating cycle activities result in cash inflows, and outflows that occur at different times. On the issuer’s balance sheet, future cash outflows within the operating cycle are recorded as short-term liabilities (current liabilities), while future cash inflows are recorded as short-term assets (current assets).
Tables 1 and 2 contain the definition, recognition, and derecognition of different cash outflows and inflows.
$$ \textbf{Table 1: Short-Term Assets Information} \\
\begin{array}{c|c|c|c}
\textbf{Short-term} & \textbf{Definition} & \textbf{Recognition} & \textbf{Derecognition} \\
{\textbf{Assets} }& & & \\ \hline
{\text{Account} \\ \text{receivable} } & {\text{Payment to be} \\ \text{collected from} \\ \text{customers for} \\ \text{services or goods} \\ \text{sold.} } & {\text{When goods are} \\ \text{sold to customers} \\ \text{on credit.} } & { \text{When payment is} \\ \text{received from the} \\ \text{customer. } } \\ \hline
\text{Inventory} & { \text{Cost of goods} \\ \text{purchased or} \\ \text{produced for sale.} } & { \text{When the issuer} \\ \text{takes ownership of} \\ \text{the materials, goods,} \\ \text{suppliers, and other} \\ \text{inventories.} } & { \text{Derecognized} \\ \text{when ownership} \\ \text{rights are} \\ \text{transferred to the} \\ \text{customer (sold to} \\ \text{the customer)} }
\end{array} $$
$$ \textbf{Exhibit 2: Short-Term Liabilities Information} \\
\begin{array}{c|c|c|c}
\textbf{Short-term} & \textbf{Definition} & \textbf{Recognition} & \textbf{Derecognition} \\
{\textbf{Liabilities} }& & & \\ \hline
{\text{Accounts} \\ \text{Payable} } & { \text{Payment owed to} \\ \text{suppliers for} \\ \text{services or goods} \\ \text{received.} } & { \text{Recognized when} \\ \text{the issuer receives} \\ \text{the goods and} \\ \text{service, and} \\ \text{payment is} \\ \text{deferred to the} \\ \text{supplier.} } & { \text{When the supplier} \\ \text{is paid.} }
\end{array} $$
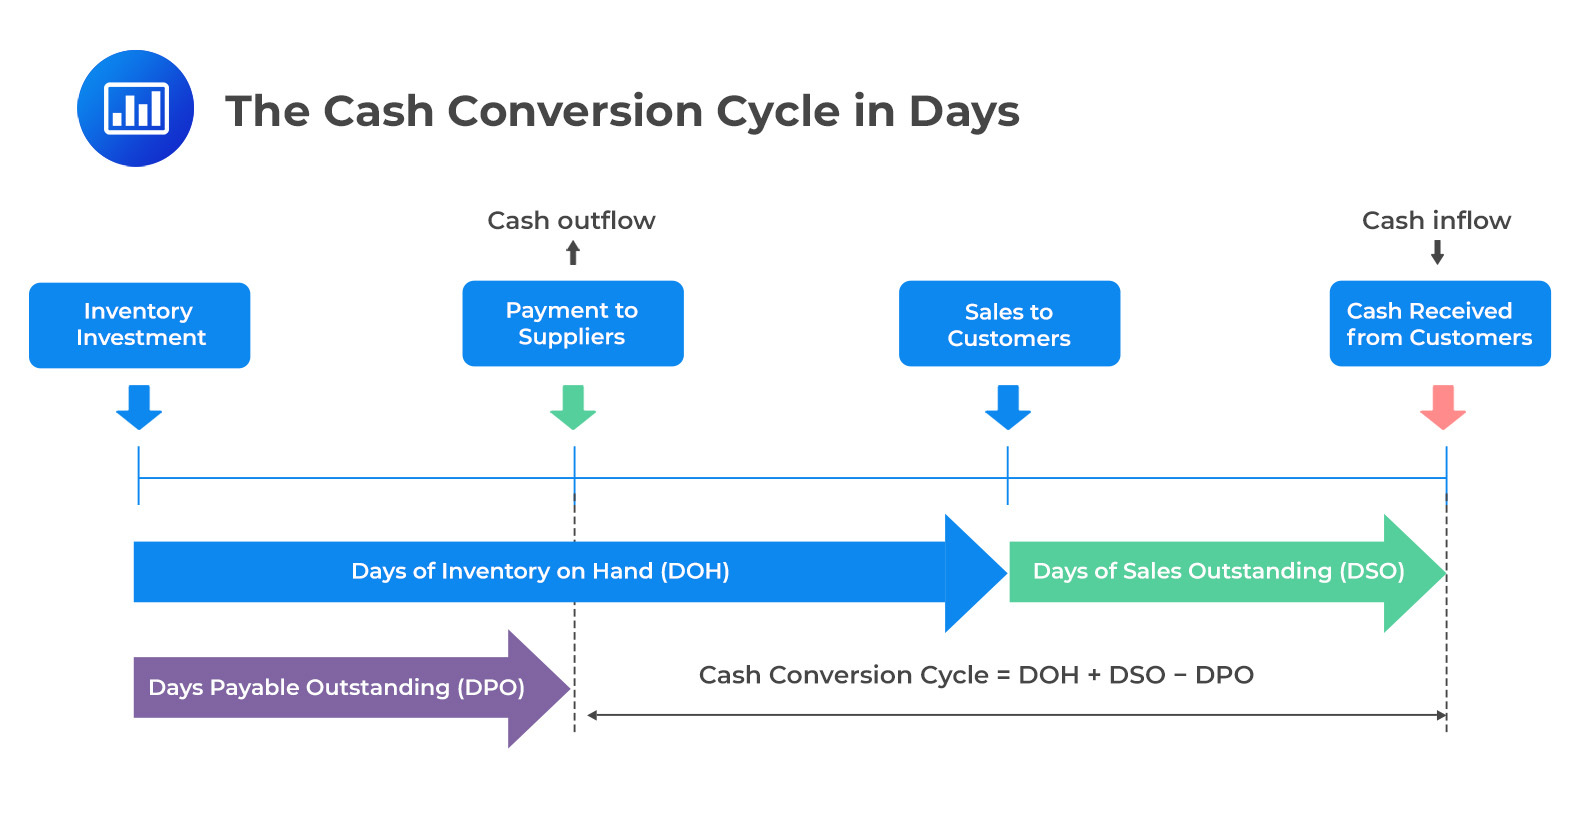
The average duration of each of these short-term accounts can be used to create a timeline for a corporate issuer’s operating cycle. Analysts construct the cash conversion cycle by using days of inventory on hand (DOH), days payable outstanding (DPO), and days sales outstanding (DSO).
The cash conversion cycle is the amount of time between an issuer’s payment to its suppliers and receiving cash from customers. In other words, the cash conversion cycle is the time between the derecognition of accounts payable and the derecognition of accounts receivables.
The cash conversion cycle is mathematically expressed as follows:
$$ \begin{align*}
\text{Cash conversion cycle} = & \text{Days of inventory on hand} + \text{Days sales outstanding} \\ -& \text{Days payable outstanding} \\ = & DOH+DSO-DPO \end{align*} $$
From the equation above, the cash conversion cycle can be seen as the number of days it takes for a company to convert inventory investment into cash receipts from customers. Consider the following diagram:
When the cash conversion cycle is longer, the company will need more time to finance the payment of its bills because it has not received cash from its customers. Some industries, for instance, airlines, tend to have a shorter cash conversion cycle because of minimal inventory and prepaid sales. On the other hand, some industries, for instance, pharmaceuticals, tend to have a longer cash conversion cycle because they need to keep more inventory.
A short or even negative cash conversion cycle is preferred since the cash can be used to finance other activities, reducing the dependence on alternative financing options to fund operations. A negative cash conversion cycle results from a company receiving cash from customers before the suppliers are paid.
Intuitively from the cash conversion cycle formula, the following are ways a corporate issuer can shorten its cash conversion cycle:
Lengthening the days payable outstanding can enhance the cash conversion cycle. However, some suppliers may offer discounts for prompt or early payment. If a company forgoes this discount to extend the days payable outstanding, it implicitly borrows from the supplier for the extra days at the cost of the forgone discount.
For example, assume that a company is given the following trade credit terms: “3/10, net 30”. This implies that a supplier will give the company a 3% discount if the account is paid within 10 days; otherwise, the full amount is due by the 30th day.
Suppose a company decides to forego this discount for a payment on the 30th day. In that case, the company implicitly borrows from the supplier for 20 (=30-20) days at a cost equivalent to the foregone discount.
A remedy to this problem is for a corporate issuer to borrow from a bank at a low interest rate, pay the supplier early to qualify for the discount, and repay the bank later. However, we need to calculate the effective annual rate (EAR) of supplier financing and compare it with the bank’s EAR on the loan.
The effective annual rate (EAR) of supplier Financing is given by:
$$ \begin{align*} & \text{EAR of Supplier Financing} \\ & =\left[\left(1+\frac{\text{Discount }\%}{100\%-\text{Discount }\%}\right)^\frac{\text{Days in Year}}{\text{Payment Period}-\text{Discount Perios}}\right]-1 \end{align*} $$
If the effective annual rate of the supplier financing is higher than the interest rate on the bank loan, then the company should borrow from its bank and pay the supplier early, and vice versa.
Example: Comparing Trade Credit and Borrowing from a Bank
Assume that a manufacturing company is given the following terms of trade credit: “2/10, net 30” by one of its raw materials suppliers. Further, the company lacks enough cash to pay its suppliers to take advantage of the discount.
The company decides to borrow from its local bank at an annual rate of 10% to pay its suppliers within 10 days. Is this a prudent move?
Solution
We need to calculate the effective annual rate on the trade credit:
$$ \begin{align*} & \text{EAR of Supplier Financing} \\ & =\left[\left(1+\frac{\text{Discount }\%}{100\%-\text{Discount }\%}\right)^\frac{\text{Days in Year}}{\text{Payment Period}-\text{Discount Periods}}\right]-1 \\ &
=\left[\left(1+\frac{2\%}{100\%-2\%}\right)^\frac{365}{30-10}\right]-1=44.59\% \end{align*} $$
Since the effective annual rate of 44.59% on supplier financing is higher than the 10% interest rate on the bank loan, the company should take the bank loan. By takinig a bank loan, the company retains the cash and pays a lower interest rate on the financing.
A long cash conversion cycle can be an indicator of business model or industry characteristics. However, it becomes a problem when a company’s cash conversion cycle is longer than that of its competitor or when it is lengthening over time, as this can be an indicator of poor customer credit quality, declined customer demand, or the loss of bargaining power with suppliers.
In addition to the cash conversion cycle, working capital is also used to measure the efficiency of business operations. A broad measure of working capital is the total working capital defined as:
$$ \text{Total working capital}=\text{Current assets}-\text{Current liabilities} $$
Net working capital is a measure of working capital that excludes items minimally associated with the cash conversion cycle or business operations. Such items include cash, marketable securities, and short-term debt.
$$ \begin{align*}
\text{Net working } & \text{capital} \\ & =\text{Current assets}\left(\text{excluding cash and marketable securities}\right) \\ & -\text{Current liabilities(excluding short-term and current debt)} \end{align*} $$
Total or net working capital is often expressed as a percentage of sales to enable comparability across firms. The ratio of working capital to sales and the cash conversion cycle are interrelated i.e., a long cash conversion cycle is associated with a high working capital-to-sales ratio and vice versa. Industries such as the pharmaceutical industry that hold large inventories due to regulations generally have a high ratio of working capital to sales and a long cash conversion cycle.
Example: Calculating Total Working Capital and Net Working Capital
Consider the following balance sheet for Company ABC (in $ million):
$$ \begin{array}{l|r}
\text{Cash} & 150 \\
\text{Marketable securities} & 400 \\
\text{Accounts receivable} & 500 \\
\text{Inventory} & 900 \\
\text{Prepaid expenses} & 600 \\
\text{PPE} & 20,000 \\ \hline
\text{Total Assets} & 22,550 \\ \\
\text{Accounts payable:} & 600 \\
\text{Accrued expenses} & 80 \\
\text{Short-term debt} & 1,200 \\ \hline
\text{Total liabilities} & 1,880 \\ \hline
\end{array} $$
Calculate total working capital and net working capital.
$$ \text{Total working capital}=\text{Current assets}-\text{Current liabilities} $$
$$ \begin{align*}
\text{Current assets} & =(\text{Cash}+\text{marketable securities}+\text{Accounts receivable} \\ & +\text{Inventory}+\text{Prepaid expenses}) \\ & =150+400+500+900+600=2,550 \\
\text{Current Liabilities}& =\text{Accounts Payable}+\text{Accrued Expenses} \\ & +\text{Short term debt} \\ & =600+80+1,200=1,880 \\
\therefore \text{Working Capital} &=2,550-1,880=670 \end{align*} $$
$$ \begin{align*}
\text{Net working }& \text{capital} \\ & =\text{Current assets(excluding cash and marketable securities)} \\ & -\text{Current liabilities(excluding short-term and current debt)} \\ & =\left[2,550-\left(150+400\right)\right]-\left[1,880-\left(1,200\right)\right]=1,320 \end{align*} $$
Question
Due to limited cash flow, an issuer must decide which supplier terms are the least costly. The credit term with the lowest effective interest rate (EAR) of supplier financing is most likely:
- \(\cfrac {2}{10}, \text{ net } 50\).
- \(\cfrac {3}{10}, \text{ net } 40\).
- \(\cfrac {2}{15}, \text{ net } 60\).
Solution
C is correct.
Foregoing a discount offered by the supplier or vendor has an implicit financing cost depending on the amount of the discount forgone and the length of the payment period after the discount period. Calculations of the cost of financing, expressed as an effective annual rate, for each set of credit terms, are as follows:
$$ \begin{align*} & \text{EAR of Supplier Financing} \\ & =\left[\left(1+\frac{\text{Discount }\%}{100\%-\text{Discount }\%}\right)^\frac{\text{Days in Year}}{\text{Payment Period}-\text{Discount Periods}}\right]-1 \end{align*} $$
$$ \text{EAR of} \cfrac{2}{10}, \text{ net } 50 =\left(\left(1+\frac{2%}{100\%-2%}\right)^\frac{365}{50-10}\right)-1=0.2024 \text{ or } 20.24\% $$
$$ \text{EAR of } \cfrac{3}{10}, \text{ net } 50 =\left({\left(1+\frac{3\%}{100\%-3\%}\right)}^\frac{365}{40-10}\right)-1=0.4485 \text{ or } 44.85\% $$
$$ \text{EAR of }\cfrac{2}{15}, \text{ net } 60=\left(\left(1+\frac{2%}{100%-2%}\right)^\frac{365}{60-15}\right)-1=0.1780 \text{ or } 17.80\% $$
Therefore, the credit terms with lower EAR of supplier financing ins \(\cfrac {2}{15}, \text{ net } 60\).
Access CFA Level I corporate issuers study notes, practice questions, mock exams, and video lessons to strengthen your understanding of the cash conversion cycle and working capital management.


Get Ahead on Your Study Prep This Cyber Monday! Save 35% on all CFA® and FRM® Unlimited Packages. Use code CYBERMONDAY at checkout. Offer ends Dec 1st.