


Stakeholder Management
[vsw id=”KxjLLIVuAg0″ source=”youtube” width=”611″ height=”344″ autoplay=”no”] Proper stakeholder management is critical to the... Read More

Computing the NPV and IRR of a project to determine which project(s) among many others to undertake is not always as easy and straightforward as it seems. The IRR and NPV can, in fact, produce different ranking outcomes whenever mutually exclusive projects are involved. Other challenges may also arise.
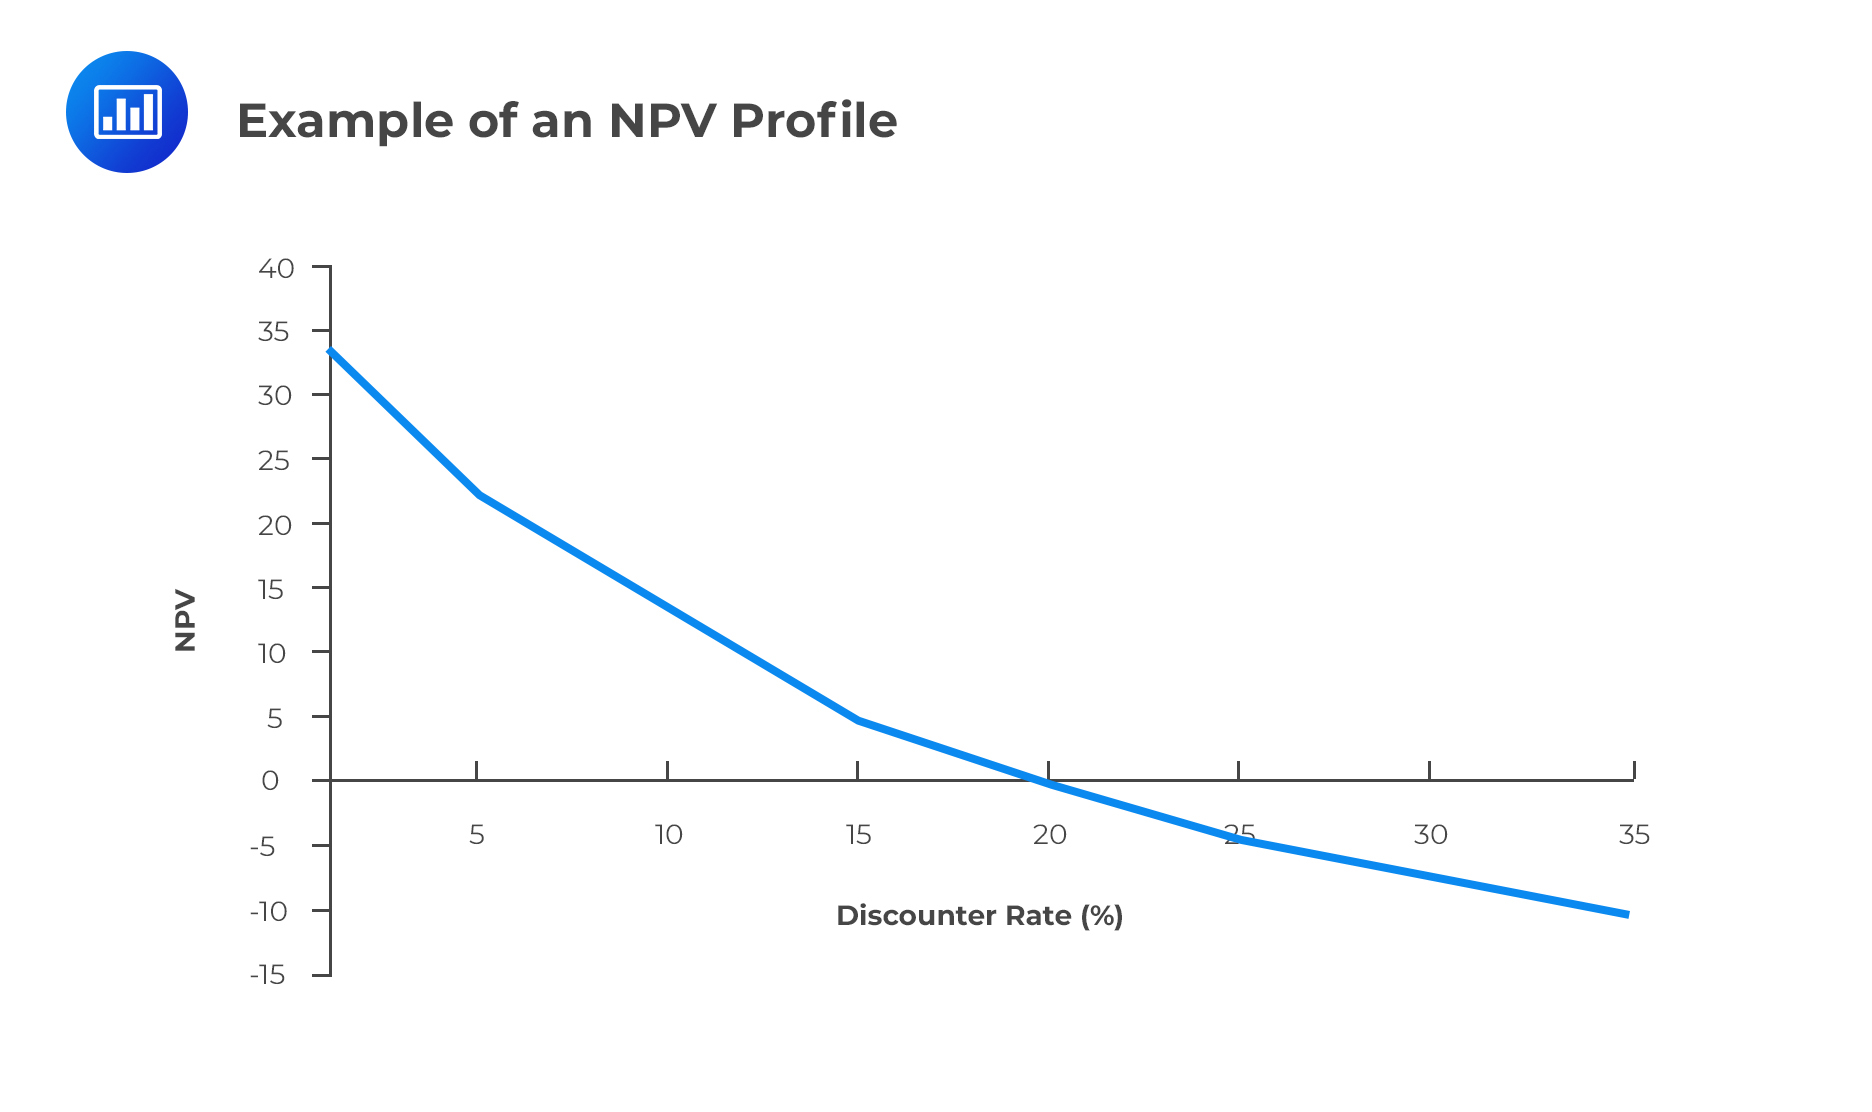
The NPV Profile is a graphical illustration of a project’s NPV graphed as a function of various discount rates. The NPV values are graphed on the vertical or y-axis while the discount rates are graphed on the horizontal or x-axis.
For independent, conventional projects, the decision rules for the NPV and IRR will both draw the same conclusion on whether to invest or not. However, in the case of two mutually exclusive projects, sometimes the decision rules will draw different conclusions. For example, project X might have a larger NPV than project Y, and project Y, a larger IRR. This conflict usually stems from differences in the cash flows of the two projects, which leads to a different ranking between the NPV and IRR. Whenever this conflict arises, the NPV, and not the IRR, should be used to select the project to invest in.
Another circumstance that may cause mutually exclusive projects to be ranked differently according to NPV and IRR criteria is the scale or size of the project.
It is quite possible, although rare, for a project to have more than one IRR, or no IRR at all. Multiple IRRs, however, cannot occur in conventional projects which have outlay followed by cash inflows. Nevertheless, they may occur in non-conventional projects which have cash flows whose signs change (negative, positive) more than once during the the life of a project.
Question
In an NPV profile, the point at which the profile crosses the x-axis is best described as:
- The IRR of the project.
- The point at which the NPV is highest.
- The point at which the discount rate = 0% and the NPV is the sum of the undiscounted cash flows for the project.
Solution
The correct answer is A.
At the horizontal axis, the NPV = 0, and by definition, this occurs whenever the discount rate is the IRR.
Corporate Finance – Learning Sessions
Master capital budgeting concepts with CFA-style practice on NPV profiles, IRR comparisons, crossover rates, and project ranking decisions.


Get Ahead on Your Study Prep This Cyber Monday! Save 35% on all CFA® and FRM® Unlimited Packages. Use code CYBERMONDAY at checkout. Offer ends Dec 1st.