Probability Trees
A tree diagram is a visual representation of all possible future outcomes and... Read More
Modern Portfolio Theory (MPT) evaluates investment options based on mean return and return variance. This approach is applicable when investors are risk-averse, meaning they seek to maximize their expected satisfaction or utility from their investments.
Mean-return analysis holds under two assumptions:
The mean-variance analysis can be reasonably accurate even if the two assumptions aren’t entirely met. Professionals prefer using observable data, such as returns. The assumption that returns roughly follow a normal distribution has played a crucial role in applying MPT.
Mean-variance analysis only considers risk symmetrically. This implies that standard deviation reflects variability above and below the mean. An alternative strategy is focusing on downside risk. One such method is safety-first rules.
Before we dive into safety-first rules, let’s discuss shortfall risk.
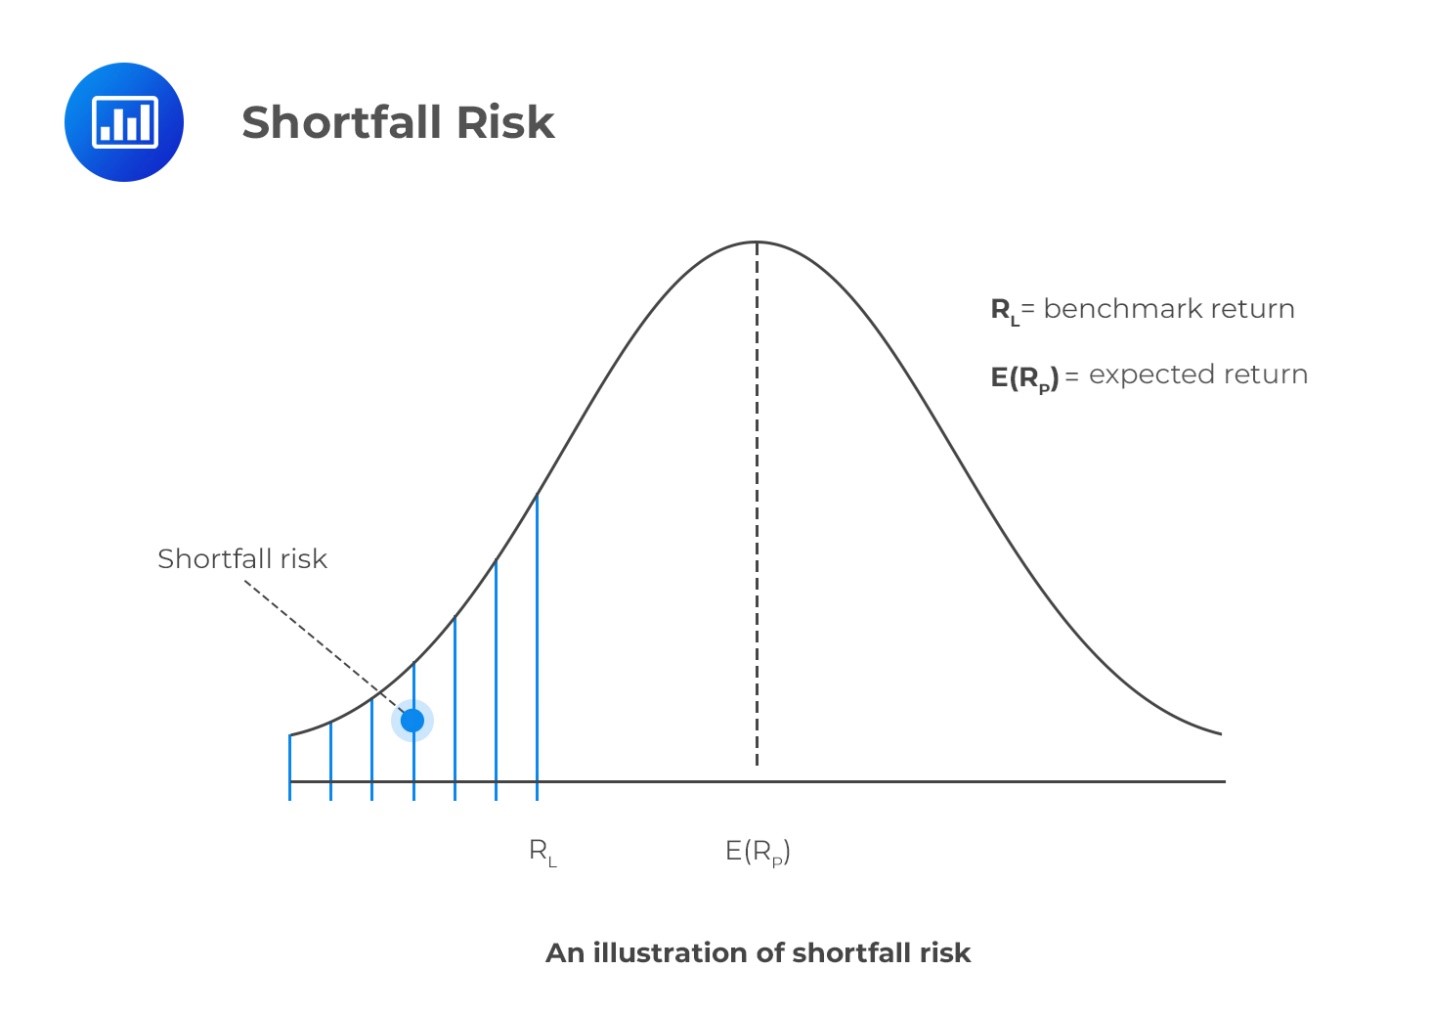
Shortfall risk refers to the probability that a portfolio will not exceed the minimum (benchmark) return an investor sets. In other words, it is the risk that a portfolio will fall short of the level of return considered acceptable by an investor. As such, shortfall risks are downside risks. While a shortfall risk focuses on the downside economic risk, the standard deviation measures the overall volatility of a financial asset.

Roy’s safety-first criterion states that the optimal portfolio is the one that minimizes the probability that a portfolio return, denoted by \(R_P\), may fall below the threshold level of return, \(R_L\). The optimal portfolio minimizes \(P(R_P \lt R_L)\)
As such, if returns are distributed normally, the optimal portfolio is the one with the highest safety-first ratio defined as:
$$ \text{SFRatio}= \frac {E(R_P)-R_L}{\sigma_P} $$
The numerator, \(E(R_P-R_L)\), represents the distance from the mean return to the threshold level, i.e., it measures the excess return over and above the threshold level of return per unit risk.
Intuitively, if the returns are normally distributed, the safety-first optimal portfolio maximizes the SFRatio.
Given a portfolio SFRatio, the probability that its return will be less than \(R_L\) is:
$$ P(R_P \lt R_L)=N(-\text{SFRatio}) $$
The safety-first optimal portfolio has the lowest \(P(R_P\lt R_L)\).
Example: Safety-first Ratio
An investor sets a minimum threshold of 3%. There are three portfolios from which he is to choose one. The expected return and the standard deviation for each portfolio are given below:
$$ \begin{array}{c|c|c|c}
& \textbf{Portfolio A} & \textbf{Portfolio B} & \textbf{Portfolio C} \\ \hline
\text{Expected return} & 5\% & 10\% & 20\% \\ \hline
\text{Standard deviation} & 15\% & 20\% & 25\%
\end{array} $$
What is the optimal portfolio for the investor?
Solution
Compute the safety-first ratio for each of the three portfolios and then compare them.
For portfolio \(A\):
$$ \text{SFRatio}_A =\frac {5-3}{15}=0.1333 $$
Similarly, for portfolio B:
$$ \text{SFRatio}_B = \frac {10-3}{20}=0.35 $$
Lastly:
$$ \text{SFRatio}_C=\frac {20-3}{25}=0.68 $$
The optimal portfolio should maximize the safety-first ratio. Comparing the three ratios, it is easy to notice that the safety-first ratio for portfolio \(C\) is the highest. Therefore, the investor should choose portfolio \(C\).
Question
The returns on a fund are distributed normally. At the end of year \(t\), the fund has a value of $100,000. At the end of year \(t+1\), the fund manager wishes to withdraw $10,000 for further funding but is reluctant to tap into the $100,000. There are two investment options:
$$ \begin{array}{c|c|c}
& \textbf{Portfolio A} & \textbf{Portfolio B} \\ \hline
\text{Expected return} & 14\% & 13\% \\ \hline
\text{Standard deviation} & 17\% & 20\% \end{array} $$Which portfolio is preferable for the manager?
- Portfolio A.
- Portfolio B.
- The manager is indifferent to the two portfolios.
Solution
The correct answer is A.
First, you should calculate the threshold return from the information given. Since there should be no tapping into the fund, the threshold return is:
$$
\frac {10,000}{100,000}=10\% \text{ or } 0.1 $$You should then calculate the safety-first ratio for each portfolio:
$$ \begin{align*}
\text{SFRatio}_A & =\frac {14-10}{17}=0.24 \\
\text{SFRatio}_B & = \frac {13-10}{20}=0.15 \end{align*} $$Portfolio \(A\) has the highest safety-first ratio. This is the reason it is the most desirable.
You can also go a step further and calculate \(P(R_P \lt R_L)\). To do this, you would have to negate each safety-first ratio and then find the CDF of the standard normal distribution for the resulting value. That is,
$$ \begin{align*}
P(R_P \lt R_L )&=N(-\text{SFRatio}) \\
N(-0.24) &=1-N(0.24)\\ &=1-0.5948=0.4052 \\
N(-0.15) &=1-N(0.15)\\&=1-0.5596=0.4404
\end{align*} $$$$ (-\text{where SFRatio is the z-value}) $$
For portfolio \(A\), there is approximately a 40% probability of obtaining a return below the threshold return. For portfolio \(B\), this probability rises to 44%. Therefore, we choose the option for which the chance of not exceeding the benchmark return is lowest – portfolio \(A\).
Get Ahead on Your Study Prep This Cyber Monday! Save 35% on all CFA® and FRM® Unlimited Packages. Use code CYBERMONDAY at checkout. Offer ends Dec 1st.