Contingency Tables
A contingency table is a tabular representation of category-based data. It shows the... Read More
Covariance is a measure of how two variables move together. The sample covariance of X and Y is calculated as follows:
$$
\mathrm{S}_{\mathrm{XY}}=\frac{\sum_{\mathrm{i}=1}^{\mathrm{N}}\left(\mathrm{X}_{\mathrm{i}}-\overline{\mathrm{X}}\right)\left(\mathrm{Y}_{\mathrm{i}}-\overline{\mathrm{Y}}\right)}{\mathrm{n}-1}
$$
A major drawback of covariance is that it is difficult to interpret since its value can vary from negative infinity to positive infinity.
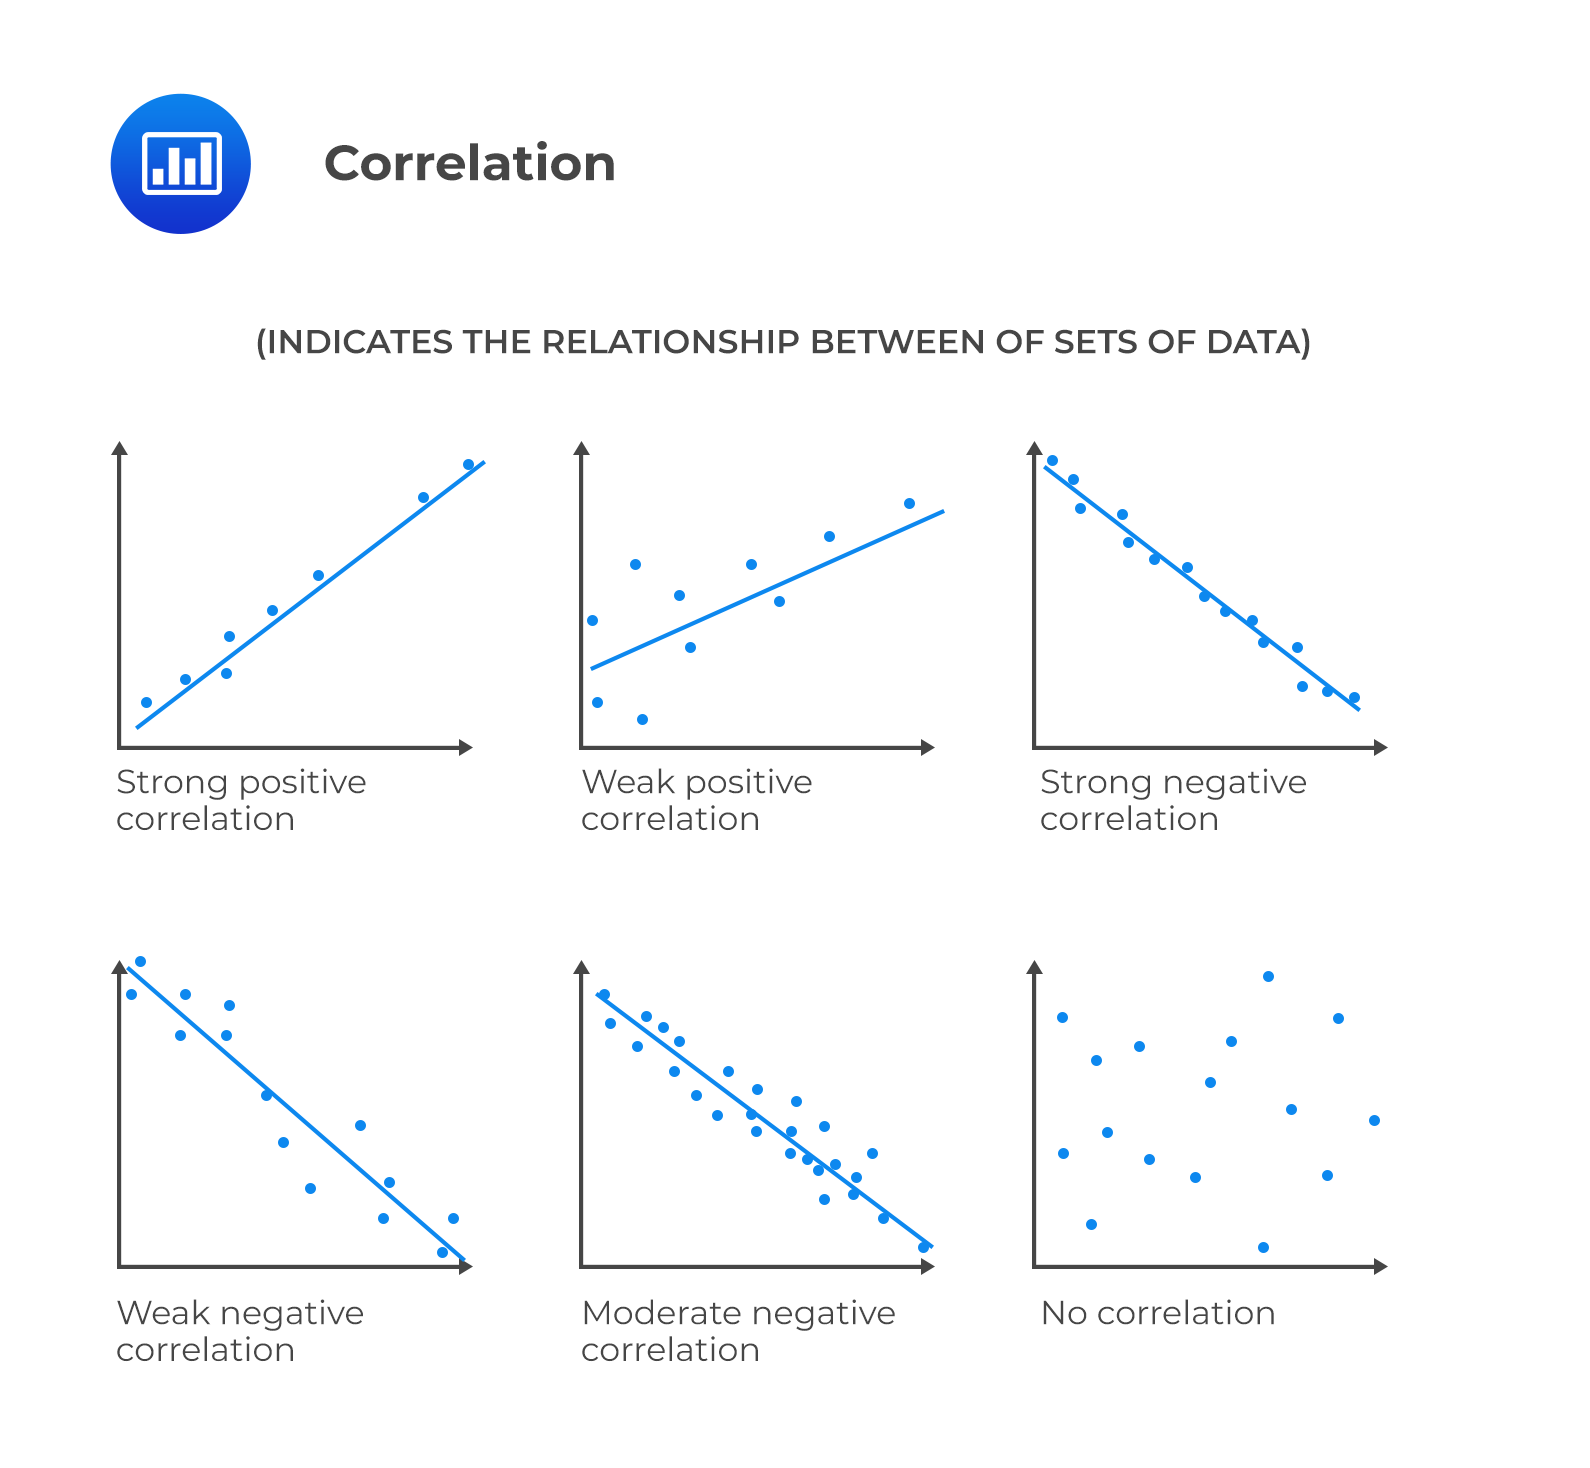
Correlation is a measure of the linear relationship between two variables. It takes the covariance and divides it by the product of the standard deviations of both variables. As a result, its value ranges between -1 and +1 and is easier to interpret.
The sample correlation coefficient is calculated as follows:
$$ r_{X Y}=\frac{s_{X Y}}{s_{x} \times s_{y}} $$
Where:
\(s_{X Y}\) = Covariance between variable X and Y.
\(s_{X}\) = Standard deviation of variable X.
\(s_{Y}\) = Standard deviation of variable Y.

Question
The correlation coefficient between X and Y is 0.7 and the covariance is 29. If the variance of Y is 25, the variance of X is closest to:
- 8.29.
- 29.
- 68.65.
Solution
The correct answer is C.
$$\begin{align} r_{X Y} &=\frac{s_{X Y}}{s_{X} \times S_{Y}}\\ \Rightarrow 0.7 &=\frac{29}{X \bullet 5} \\ \therefore X&=8.2857\\ \\ \text{Variance} &=8.2857^2=68.65 \end{align}$$
Get Ahead on Your Study Prep This Cyber Monday! Save 35% on all CFA® and FRM® Unlimited Packages. Use code CYBERMONDAY at checkout. Offer ends Dec 1st.