Measures of Return
Financial assets are primarily defined based on their return-risk characteristics. This definition approach... Read More
Elliott wave theory was developed by Ralph Nelson Elliott in late 1930s. His discovery changed the perception about stock market trading, which was thought to be chaotic and disorganized at the time. The theory revealed that trading, in fact, follows repetitive cycles.
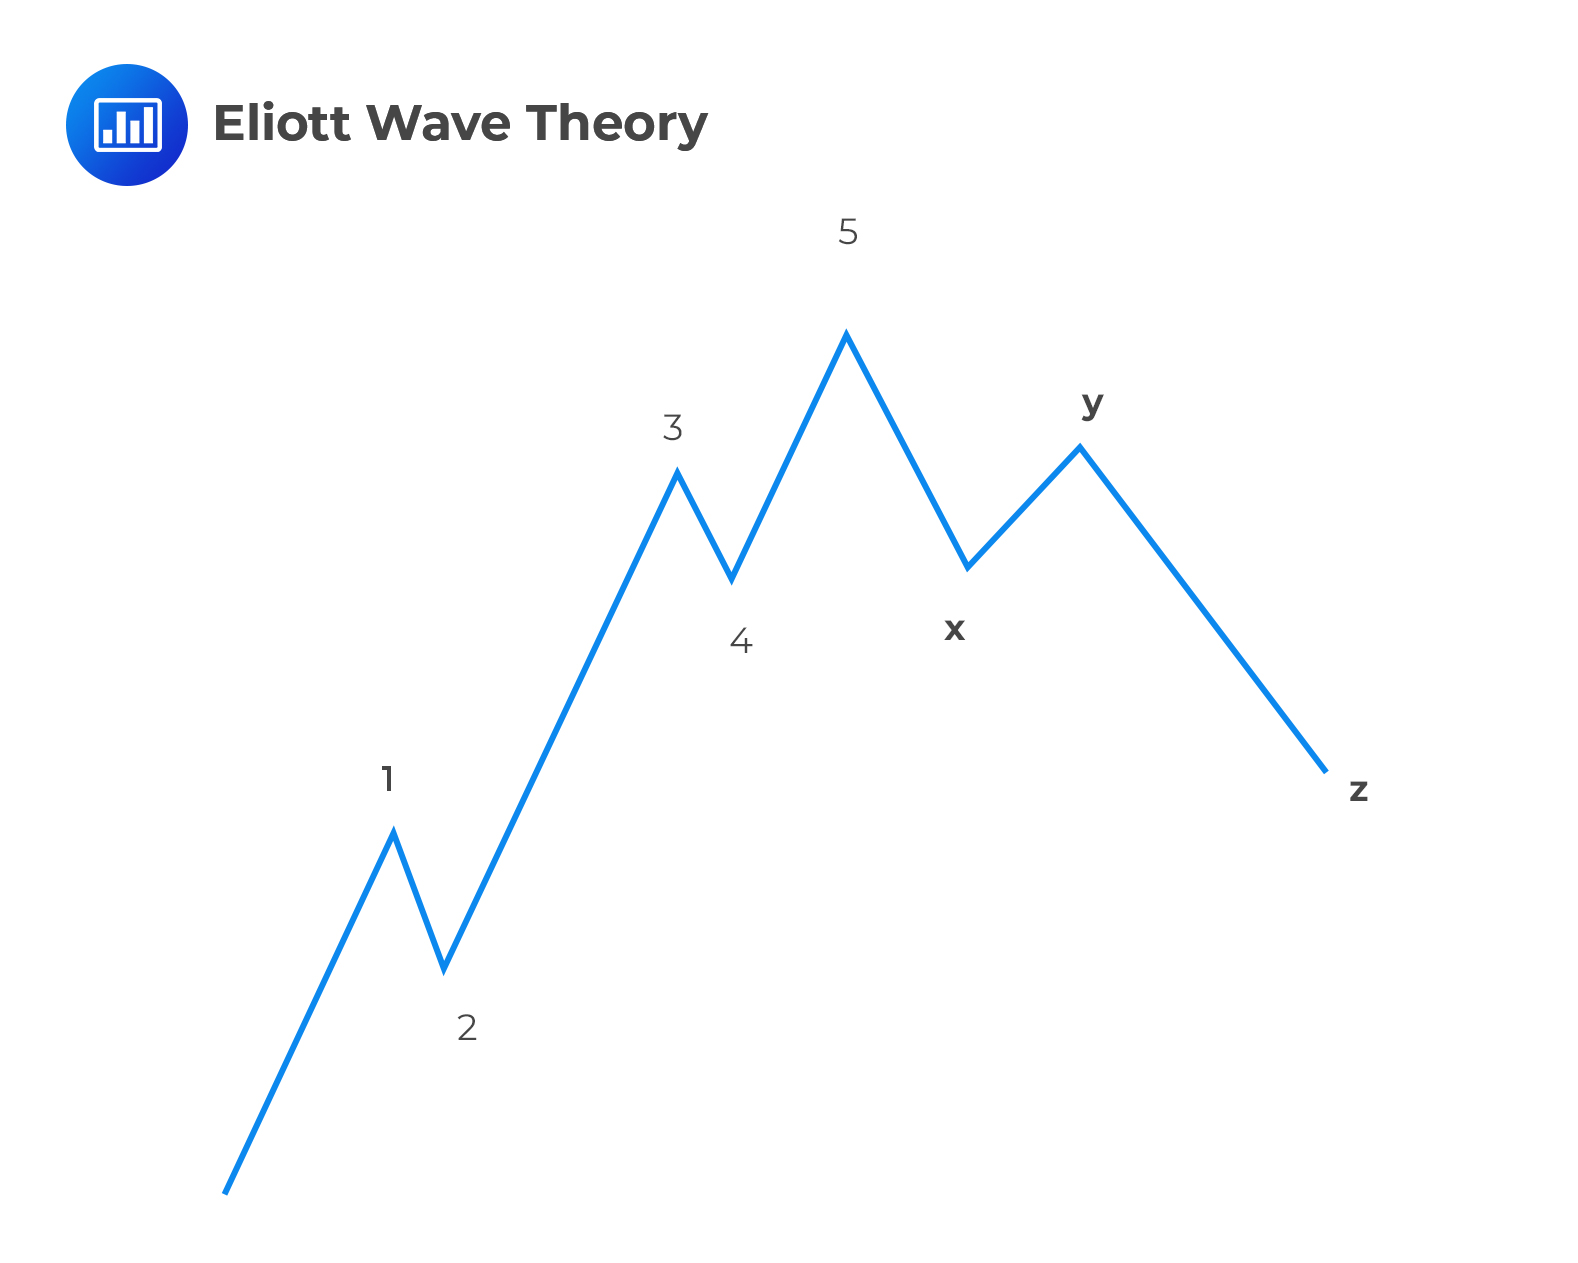
According to the Elliott wave theory, cycles that are repetitive and quite predictable can be observed in stock price movements. The movements can be categorized into two: motive waves and corrective waves. The former category refers to movements in the direction of the existing trend while the latter refers to movements against the trend. The two types, when combined, form the heartbeat of the Elliott wave theory. The theory actually discredits and runs against the efficient market hypothesis.
Elliott put forth the argument that market cycles could be traced back to outside influences coupled with the predominant psychology of market participants. Furthermore, he argued that behind the upward and downward swings exhibited by the market lay corresponding shifts in mass psychology, resulting in repetitive patterns. It is actually these patterns that were later categorized into the motive waves and the corrective ones.

In the figure above, the motive waves are numbered 1, 2, 3, 4, and 5. The three letters – x, y, and z – are corrective waves going against the global trend.
Elliott’s work also linked market wave patterns to the Fibonacci sequence, which was developed by Leonardo Fibonacci in the 11th century. The Fibonacci sequence sets off with the numbers 0, 1, and 1 again. After this point, each subsequent number is the sum of the two prior numbers:
{0, 1, 1, 2, 3, 5, 8, 13, 21, 34, 55, …}
Elliott found out that the ratio of the size of subsequent waves was, in fact, the Fibonacci ratio. The following are some of the most important ratios:
1/2 = 0.50;
2/3 = 0.6667;
3/5 = 0.6;
5/8 = 0.625; and
8/13 = 0.6154.
Elliott wave advances the belief that the above ratios are useful when estimating price movements and targets. For instance, a down leg can be 3/5 the size of an up leg. Using the same logic, a future price can be 8/13 of the current price.
A quick computation can confirm that as the numbers in the sequence get larger, their ratios converge at 0.618 and 1.618. These two are known as the magical numbers in the world of finance and can be used to predict future price targets.
Reading 56 LOS 56g:
Describe the key tenets of Elliott Wave Theory and the importance of Fibonacci numbers
Get Ahead on Your Study Prep This Cyber Monday! Save 35% on all CFA® and FRM® Unlimited Packages. Use code CYBERMONDAY at checkout. Offer ends Dec 1st.