Seniority Rankings of Corporate Debt
Capital structure is the composition of a company’s debt and equity, such as... Read More
[vsw id=”ys7hMfL_EIs” source=”youtube” width=”611″ height=”344″ autoplay=”no”]
Time horizon is an important aspect of understanding interest rate risk and the return characteristics of a fixed-rate investment. The primary concern for an investor is the change in the price of a bond given a sudden change in its yield-to-maturity. Therefore, reinvestment of coupon interest is a key factor in the investor’s horizon yield.
Prices of fixed income securities are affected not only by the level of interest rates but also the volatility of interest rates. The risk of a default-free security emanates from two sources: interest rate shift and the risk of changes in interest rate volatility.
To manage this type of risk, analysts have to measure it first. In this regard, duration becomes a particularly important tool since it helps the analyst establish the sensitivity of a portfolio to changes in interest rates.
This type of risk is less obvious but represents a major component of the total risk of a fixed income security. For a given duration and current value of a position, the interest rate and the expected yield volatility increase simultaneously.
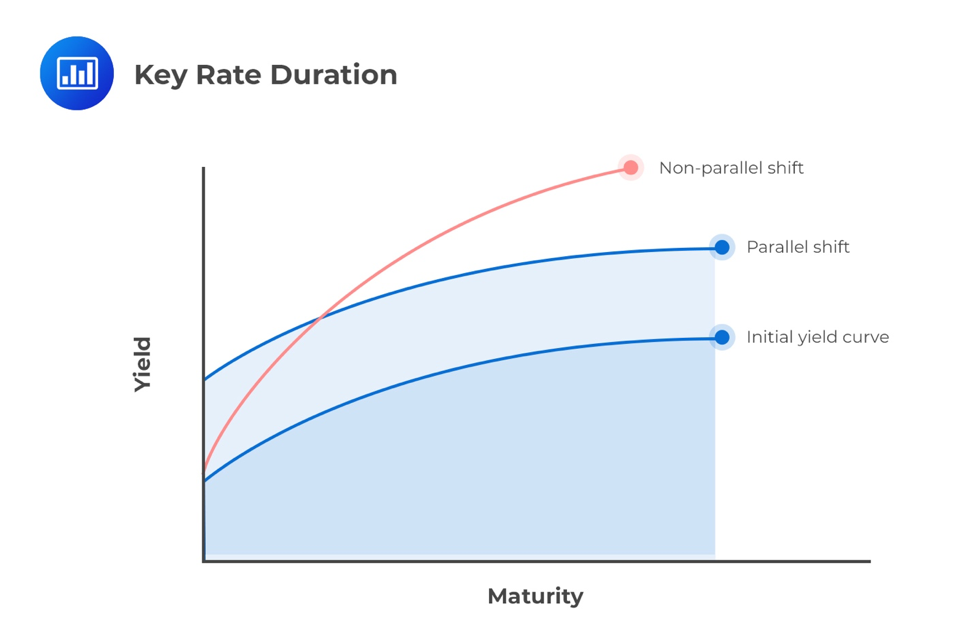
When the government par-curve is shifted up or down by some amount to calculate effective duration and effective convexity, it is described as a “parallel” yield curve shift. Yield curves are rarely straight lines, so this shift may also be described as a “shape-preserving” shift to the yield curve.

In case of a parallel shift of the yield curve, the yield-to-maturity and coupon reinvestment rates are assumed to have changed by the same amount and in the same direction. Macaulay duration is particularly important because it identifies the investment horizon such that losses (or gains) from coupon reinvestment offset gains (or losses) from changes in market prices.
The term structure of yield volatility is the relationship between the volatility of bond yields-to-maturity and times-to-maturity. The term structure of bond yields (also called the “term structure of interest rates”) is typically upward sloping. However, it can be different depending on some factors, including government policy.
For instance, a central bank engaging in an expansionary monetary policy might cause the yield curve to steepen by reducing short-term interest rates. However, this policy might result in greater volatility in short-term bond yields to maturity than in longer-term bonds. This is because longer-term bond yields are mainly determined by future inflation and economic growth expectations. Such expectations are often less volatile.
Question
An investment bank needs to rank 3 bonds in terms of interest rate risk.
$$
\begin{array}{l|c|c|c}
\textbf{Bond} & \textbf{Modified Duration} & \textbf{Convexity} & \textbf{Yield} \\
\hline
\text{A} & \text{3.50} & \text{100} & \text{25} \\
\text{B} & \text{5.25} & \text{350} & \text{15} \\
\text{C} & \text{5.30} & \text{250} & \text{10} \\
\end{array}
$$The modified duration and convexity statistics are annualized. Given the predicted change in yield in each of these bonds, how should the bonds be ranked in terms of interest rate risk (from the highest risk to the lowest)?
- Bond A has the highest degree of interest rate risk, followed by Bond B, and Bond C.
- Bond B has the highest degree of interest rate risk, followed by Bond C, and Bond A.
- Bond C has the highest degree of interest rate risk, followed by Bond B, and Bond A.
Solution
The correct answer is A.
Based on the assumed changes in the yields and given measures of modified duration and convexity, Bond A has the highest degree of interest rate risk followed by Bond B, and then Bond C.
Bond A: %ΔPVFULL ≈ (-3.50×0.0025) + (1/2×100×(0.0025)2) ≈ -0.0084375
Bond B: %ΔPVFULL ≈ (-5.25×0.0015) + (1/2×350×(0.0015)2) ≈ -0.0074813
Bond C: %ΔPVFULL ≈ (-5.30×0.0010) + (1/2×250×(0.0010)2) ≈ -0.005175
Get Ahead on Your Study Prep This Cyber Monday! Save 35% on all CFA® and FRM® Unlimited Packages. Use code CYBERMONDAY at checkout. Offer ends Dec 1st.