


Quality of Financial Reports and Earni ...
Financial reporting quality relates to the quality of the information that is contained... Read More

Financial analysis helps assess a company’s financial performance over time and identify the trends in that performance. It can also be used to evaluate a company’s equity securities, assess its financial risk exposures, and perform necessary due diligence before a prospective merger or acquisition.
Given the diverse purposes for performing financial analysis, the wide range of techniques available, and the often substantial amount of data involved, it is crucial that the analytical approach be tailored to the specific situation.
Recall the steps in the financial analysis framework covered in learning module 1:
Step 1: Articulate the Purpose and Context of the Analysis
Step 2: Collect Data
Step 3: Process Data
Step 4: Analyze and Interpret the Data
Step 5: Develop and communicate conclusions and recommendations
Step 6: Follow-up
Based on financial analysis framework, before starting any financial analysis, the analyst should clearly define the purpose and context by addressing the following points:
Once the purpose and context are clarified, the analyst can choose the appropriate techniques (e.g., ratios) to best aid decision-making. Clearly, this falls under steps 3 and 4 of the financial statement analysis framework.
Several tools and techniques may be used when evaluating a company’s financial status. These tools and techniques help analysts evaluate company data through comparisons. It is challenging to determine if a company’s financial performance is “good” or “bad” without a clear basis for comparison.
To assess a company’s ability to generate and grow earnings and cash flow, and to understand the risks associated with those earnings and cash flows, analysts use:
Ratios express one quantity in relation to another, typically as a quotient. There are numerous relationships among financial accounts and expected relationships over different time periods. Ratios are an effective method for illustrating these relationships.
Several key aspects of ratio analysis are crucial to understand:
1. Ratios are indicators, not the answers: A computed ratio serves as an indicator of a company’s performance. It provides insights into what happened but not necessarily why it happened. For instance, to determine which of the two companies was more profitable, an analyst might use the net profit margin, which expresses profit relative to revenue. This is calculated by dividing net income by revenue:
$$\text{Net Profit Margin} = \frac{\text{Net Income}}{\text{Revenue}}$$
2. Accounting Policy Differences: Differences in accounting policies across companies and over time can distort ratios. Meaningful comparisons may require adjustments to the financial data to account for these differences.
3. Relevance of Ratios: Not all ratios are pertinent to every analysis. An essential analytical skill is selecting the relevant ratio(s) to answer a specific research question.
4. Interpretation is Key: Ratio analysis involves more than just computation; interpretation is crucial. Differences in ratios across time and companies can be subtle, and interpreting these differences requires a deep understanding of the specific situation.
No authoritative bodies prescribe the exact formulas for computing ratios or provide a standardized, comprehensive list of ratios. Formulas and even names of ratios can vary among analysts or databases. The potential number of different ratios is practically limitless.
However, several widely accepted ratios have proven useful. Analysts should be aware that different ratios may be used in practice, and certain industries have unique ratios tailored to their characteristics.
When faced with an unfamiliar ratio, the analyst should examine the underlying formula to understand what the ratio measures.
For example, consider the return on assets (ROA) formula:
$$\text{ROA}=\frac{\text{Operating Income}}{\text{Average Total Assets}}$$
Assume that you are unfamiliar with this ratio and that you want to check whether an ROA of 20% is better than 10%.
Examining the formula, notice that the ratio measures the amount of operating income generated per unit of assets. Thus, generating EUR 20 of operating income per EUR100 of average total assets is better than generating EUR 10. Intuitively, this ratio indicates profitability and efficiency in using assets to generate operating profits.
Needless to say, when encountering a ratio for the first time, analysts should evaluate the numerator and denominator to assess what the ratio measures and how it should be interpreted.
A good rule of thumb is that when an income statement or cash flow statement number is in the numerator and a balance sheet number is in the denominator, an average should be used for the denominator.
It is usually unnecessary to use averages when only balance sheet numbers are used in both the numerator and denominator since both are determined as of the same date. However, some instances may still require averages, such as in the decomposition of return on equity (ROE), which is defined as net income divided by average shareholders’ equity. If an average is used in one component ratio, it should be used in the other.
However, if an average is used, judgment is required about which average to use. Most ratio databases use a simple average of the beginning and end-of-year balance sheet amounts for simplicity. If the company’s business is seasonal, resulting in asset levels varying by interim period (semiannual or quarterly), using average overall interim periods, if available, may be beneficial. If the analyst has access to monthly data, this can also create a more accurate average.
Financial ratios offer insights into:
Limitations to ratio analysis include:
Ratios can be computed using financial statements of companies or from databases such as Bloomberg, Compustat, FactSet, or Thomson Reuters. These databases not only provide data reported in financial statements but also offer calculated ratios. They are favored for their extensive historical data, allowing for trend analysis over multiple years. Additionally, they enable ratio calculations for periods other than the company’s fiscal year, such as trailing 12 months (TTM) or the most recent quarter (MRQ).
Analysts need to be aware that different vendors may use distinct formulas to calculate ratios. Analysts should obtain the specific formulas from the vendor and assess whether any adjustments are needed. Database providers often apply judgment when classifying items, which can affect computations. For instance, operating income might not be directly listed on a company’s income statement, so the provider may classify items as operating or non-operating. These judgments can influence the accuracy of ratio computations.
Therefore, it’s best practice to use the same data source when comparing different companies or evaluating the historical performance of a single company. Analysts should verify the consistency of formulas and data classifications from the data source.
The process of collecting financial data from regulatory filings and calculating ratios can be automated using the eXtensible Business Reporting Language (XBRL). XBRL uses “smart tags” attached to financial information (such as total assets), allowing software to automatically gather data and perform necessary calculations. The development of XBRL is overseen by an international nonprofit consortium, including the International Accounting Standards Board (IASB). Many stock exchanges and regulatory agencies worldwide now use XBRL to receive and distribute public financial reports from listed companies.
Analysts can compare a company to its peers using vendor databases or aggregate industry data. For non-public companies, industry data can be sourced from publications like the Annual Statement Studies by the Risk Management Association or Dun & Bradstreet. These publications often categorize companies into quartiles based on their ratios, helping analysts determine a company’s relative position within the industry.
Common-size analysis entails expressing financial data, including entire financial statements, relative to a single financial statement item or base. The most commonly used bases are total assets or revenue. Essentially, common-size analysis establishes a ratio between each financial statement item and the base item.
This method was illustrated in earlier modules for the income statement, balance sheet, and cash flow statement. In this section, we delve into the common-size analysis of financial statements in greater detail and provide further discussion on their interpretation.
A vertical common-size balance sheet is created by dividing each item on the balance sheet by the total assets of the same period and expressing the results as percentages. This method highlights the composition of the balance sheet, revealing the mix of assets being used and the sources of financing. It also allows for comparisons between a company’s balance sheet composition and that of its peers, providing insights into the reasons for any differences.
A horizontal common-size balance sheet, on the other hand, is prepared by calculating the percentage increase or decrease of each balance sheet item from the previous year or by dividing the quantity of each item by the base year quantity. This approach emphasizes changes in items over time, which can then be compared to expectations.
Example: Common-size analysis of a balance sheet
Consider the following partial balance sheet of a hypothetical company, Prudential World Assets (in millions).
$$\begin{array}{l|c|c|c|c|c|c}
\textbf{Year} & \textbf{20X4} & \textbf{20X5} & \textbf{20X6} & \textbf{20X7} & \textbf{20X8} & \textbf{20X9} \\ \hline
\text{Cash } & \$60 & \$63 & \$55 & \$57.5 & \$60 & \$62.5 \\ \hline
\text{Inventory } & \$230 & \$241.5 & \$253 & \$264.5 & \$264 & \$275 \\ \hline\text{Accounts} &&&&&&\\
\text{Receivable}& \$160 & \$168 & \$176 & \$172.5 & \$180 & \$187.5 \\ \hline\text{Net Plant and} &&&&&&\\
\text{and Equipment} & \$500 & \$525 & \$561 & \$586.5 & \$624 & \$650 \\ \hline
\text{Intangibles } & \$60 & \$63 & \$55 & \$57.5 & \$60 & \$62.5 \\ \hline
\textbf{Total Assets } & \$1,000 & \$1,050 & \$1,100 & \$1,150 & \$1,200 & \$1,250 \\
\end{array}$$
Create both vertical and provide the interpretation of the trend in accounts receivables; also, create a horizontal common-size balance sheet.
Solution
The vertical common-size balance sheet is given below:
$$\begin{array}{l|c|c|c|c|c|c}
\textbf{Year} & \textbf{20X4} & \textbf{20X5} & \textbf{20X6} & \textbf{20X7} & \textbf{20X8} & \textbf{20X9} \\ \hline
\text{Cash} & 6\% & 6\% & 5\% & 5\% & 5\% & 5\% \\ \hline
\text{Inventory} & 23\% & 23\% & 23\% & 23\% & 22\% & 22\% \\ \hline\text{Accounts} &&&&&&\\
\text{Receivable} & 16\% & 16\% & 16\% & 15\% & 15\% & 15\% \\ \hline\text{Net Plant and} &&&&&&\\
\text{ Equipment} & 50\% & 50\% & 51\% & 51\% & 52\% & 52\% \\ \hline
\text{Intangibles} & 6\% & 6\% & 5\% & 5\% & 5\% & 5\% \\ \hline
\text{Total assets} & 100\% & 100\% & 100\% & 100\% & 100\% & 100\% \\
\end{array}$$
Accounts receivables remained stable at 16% of total assets during the first three years. This indicates that the proportion of assets tied up in receivables was consistent, suggesting stable credit policies and collection practices during this period.
However, there is a slight decrease to 15% in the last three years. This 1% decline suggests a few possible scenarios:
Lastly, the horizontal common-size balance sheet is given below:
$$\begin{array}{l|c|c|c|c|c|c}
\textbf{Year} & \textbf{20X4} & \textbf{20X5} & \textbf{20X6} & \textbf{20X7} & \textbf{20X8} & \textbf{20X9} \\ \hline
\text{Cash} & 100.00\% & 101.00\% & 102.01\% & 103.03\% & 104.06\% & 105.10\% \\ \hline
\text{Inventory} & 100.00\% & 103.00\% & 106.09\% & 109.27\% & 112.55\% & 115.93\% \\ \hline\text{Accounts} &&&&&&\\
\text{Receivable} & 100.00\% & 102.00\% & 104.04\% & 106.12\% & 108.24\% & 110.41\% \\ \hline \text{Net Plant } &&&&&&\\ \text{and } &&&&&&\\
\text{Equipment} & 100.00\% & 104.00\% & 108.16\% & 112.49\% & 116.99\% & 121.67\% \\ \hline
\text{Intangibles} & 100.00\% & 100.50\% & 101.00\% & 101.51\% & 102.02\% & 102.53\% \\ \hline
\text{Total assets} & \textbf{100.00%} & \textbf{103.08%} & \textbf{106.27%} & \textbf{109.57%} & \textbf{112.99%} & \textbf{116.53%} \\
\end{array}$$
The horizontal-common size balance above shows consistent annual growth in accounts receivables. This steady increase can be a positive signal of growing sales and business expansion, indicating that the company is selling more on credit terms.
Note that account receivables growth needs to be managed effectively to ensure that it translates into actual cash inflows and does not lead to significant increases in uncollectible receivables. The company should focus on maintaining a balance between extending credit to boost sales and ensuring timely collections to support cash flow.
A vertical common-size income statement involves dividing each income statement item by revenue or, in some cases, by total assets (particularly for financial institutions). For companies with multiple revenue sources, breaking down the revenue into percentage terms can be particularly useful.
Example: Interpretation of Common-Size Income Statement
Consider the following common-size income statement of a hypothetical company (in millions):
$$\begin{array}{l|c|c|c|c}
& \textbf{Period 1} & \textbf{Percent of} & \textbf{Period 2} & \textbf{Percent of} \\
& & \textbf{Total } & & \textbf{Total } \\\text{Revenue} & &\textbf{ Revenue} & &\textbf{Revenue} \\ \hline
\text{Revenue} & & & & \\
\text{source A} & 1,020 & 34\% & 1,200 & 40\% \\ \hline
\text{Revenue} & & & & \\
\text{source B} & 880 & 29\% & 600 & 20\% \\ \hline
\text{Revenue} & & & & \\
\text{source C} & 1,100 & 37\% & 1,200 & 40\% \\ \hline
\textbf{Total} & & & & \\
\textbf{revenue} & 3,000 & 100\% & 3,000 & 100\% \\ \hline
\text{Salaries and} & & & & \\
\text{employee} & & & & \\
\text{benefits} & 600 & 20\% & 660 & 22\% \\ \hline
\text{Administrative} & & & & \\
\text{expenses} & 750 & 25\% & 690 & 23\% \\ \hline
\text{Rent} & & & & \\
\text{expense} & 360 & 12\% & 330 & 11\% \\ \hline
\text{EBITDA} & 1,290 & 43\% & 1,320 & 44\% \\ \hline
\text{Depreciation and} & & & & \\
\text{amortization} & 150 & 5\% & 120 & 4\% \\ \hline
\text{EBIT} & 1,140 & 38\% & 1,200 & 40\% \\ \hline
\text{Interest paid} & 180 & 6\% & 150 & 5\% \\ \hline
\text{EBT} & 960 & 32\% & 1,050 & 35\% \\ \hline
\text{Income tax} & & & & \\
\text{provision} & 300 & 10\% & 270 & 9\% \\ \hline
\textbf{Net income} & 660 & 22\% & 780 & 26\% \\
\end{array}$$
Based on the above common-size income statement, provide interpretation on revenue dynamics, profitability analysis, efficiency in administrative and rent Expenses and effective tax rate and income tax analysis.
Solution
Revenue Dynamics:
Revenues from Service A and Service C have become a significantly greater percentage of the company’s total revenue (from 34% and 37% in Period 1 to 40% each in Period 2). Conversely, revenue from Service B has decreased from 29% to 20%. These changes may imply that the company may have strategically shifted its focus towards Services A and C due to their higher market demand or competitive advantage. This shift, however, should be examined in light of the overall profitability.
Profitability Analysis:
The company’s EBITDA has slightly increased from 43% to 44% of total revenue. This slight improvement in profitability might suggest that Services A and C have better margins compared to Service B.
The increase in operating expenses, particularly salaries and employee benefits (from 20% to 22%), indicates that Services A and C might require more specialized or higher-paid employees. This could explain the slight increase in overall profitability despite higher costs.
Efficiency in Administrative and Rent Expenses:
Administrative expenses have decreased from 25% to 23%, and rent expenses from 12% to 11%, which could indicate improved efficiency or cost management in these areas, partially offsetting the increased salary expenses.
Effective tax rate and income tax analysis:
The company’s income tax as a percentage of sales has decreased from 10% to 9%. The effective tax rate (taxes as a percentage of EBT) has also decreased from approximately 31% (= 10/32) to about 26% (= 9/35).
The lower effective tax rate might be due to a larger portion of revenues from Services A and C being generated in jurisdictions with lower tax rates. This could be a strategic move to optimize the tax burden. Moreover, there might be specific tax incentives or credits associated with Services A and C, such as R&D credits, investment incentives, or other tax benefits that reduce the overall tax liability.
The usefulness of ratios and common-size statements comes from their ability to facilitate comparisons. As such, cross-sectional analysis, also known as “relative analysis,” involves comparing a specific metric of one company with the same metric of another company or group of companies at the same point in time or over the same period. This allows for meaningful comparisons even if the companies are of different sizes or operate in different currencies.
Example: Cross-sectional Analysis
Consider the following partial vertical common-size balance sheets for two companies, A and B.
$$\begin{array}{l|c|c|c|c}&&\textbf{Percent of}&&\textbf{Percent of}\\
& \textbf{Company A} & \textbf{Total} & \textbf{Company B} & \textbf{Total} \\
\textbf{Assets}& \textbf{(millions)} & \textbf{Assets} & \textbf{(millions)} & \textbf{Assets} \\ \hline
\text{Cash} & \$60 & 6\% & \$63 & 12\% \\ \hline
\text{Receivables} & \$160 & 16\% & \$168 & 33\% \\ \hline
\text{Inventory} & \$230 & 23\% & \$241.5 & 27\% \\ \hline
\text{Fixed assets} & & & & \\\text{net of} & & & & \\
\text{ depreciation } & \$500 & 50\% & \$525 & 55\% \\ \hline
\text{Investments} & \$50 & 5\% & \$52.5 & 7\% \\ \hline
\textbf{Total Assets} & \textbf{\$1,000} & \textbf{100%} & \textbf{\$1,050} & \textbf{100%} \\
\end{array}$$
Compare the liquidity of the two companies.
Solution
Company B demonstrates significantly higher liquidity compared to Company A. Liquidity is determined by how easily assets can be converted to cash. Company B has 12 percent of its assets in cash, whereas Company A holds only 6 percent in cash. Given that cash is generally a low-yield asset and not an efficient use of excess funds, it raises the question of why Company B maintains such a high cash balance. This large cash reserve could indicate that Company B is gearing up for a potential acquisition or it might be holding cash as a buffer against a volatile operating environment.
Additionally, the comparison reveals that a substantial portion of Company B’s assets is tied up in receivables (33 percent), compared to only 16 percent for Company A. This could suggest several possibilities: a higher level of credit sales, changes in asset composition, potentially lower credit or collection standards, or even aggressive accounting practices. This higher percentage of receivables may pose risks if these receivables are not collected promptly.
When examining financial statements and ratios, it’s crucial to consider trends in the data, whether they are improving or deteriorating, along with the current absolute or relative levels. Trend analysis offers valuable insights into historical performance and growth. With a sufficiently long history of accurate seasonal data, trend analysis can be a powerful tool for planning and forecasting for both management and analysts.
Analyzing horizontal common-size balance sheets reveals structural changes within a business over time. While past trends do not always predict future performance, especially in changing economic or competitive environments, they are more valuable when these environments are stable, or the business is mature. In less stable contexts, historical analysis can still help develop expectations by providing a foundation for understanding past trends which is crucial in assessing whether these trends will continue or shift direction.
Example: Trend Analysis
Consider the following partial horizontal balance sheet of the hypothetical company Prudential World Assets.
$$\begin{array}{l|c|c|c|c|c|c}
\textbf{Year} & \textbf{20X4} & \textbf{20X5} & \textbf{20X6} & \textbf{20X7} & \textbf{20X8} & \textbf{20X9} \\ \hline
\text{Cash} & 100.00\% & 101.00\% & 102.01\% & 103.03\% & 104.06\% & 105.10\% \\ \hline
\text{Inventory} & 100.00\% & 103.00\% & 106.09\% & 109.27\% & 112.55\% & 115.93\% \\ \hline\text{Accounts} &&&&&&\\
\text{Receivable} & 100.00\% & 102.00\% & 104.04\% & 106.12\% & 108.24\% & 110.41\% \\ \hline \text{Net Plant } &&&&&&\\ \text{and } &&&&&&\\
\text{Equipment} & 100.00\% & 104.00\% & 108.16\% & 112.49\% & 116.99\% & 121.67\% \\ \hline
\text{Intangibles} & 100.00\% & 100.50\% & 101.00\% & 101.51\% & 102.02\% & 102.53\% \\ \hline
\text{Total assets} & \textbf{100.00%} & \textbf{103.08%} & \textbf{106.27%} & \textbf{109.57%} & \textbf{112.99%} & \textbf{116.53%} \\
\end{array}$$
Analyze the trends in inventory levels and net plant and equipment.
Solution
From 20X4 to 20X9, the inventory has increased by 15.93%. This cumulative growth reflects the company’s strategy to maintain higher inventory levels, which could be due to several reasons such as anticipating higher demand, reducing stockouts, or taking advantage of bulk purchasing discounts.
The net plant and equipment have shown a steady growth rate of 4% per year over the six-year period. This consistent increase indicates a continuous investment in the company’s fixed assets. From 20X4 to 20X9, the net plant and equipment have increased by 21.67%.
The steady investment in net plant and equipment suggests that the company may be pursuing a strategy of expansion, modernization, or increased production capacity.
Trend data generated by horizontal common-size analysis can be compared across financial statements to provide insights into a company’s performance. For example, if revenue is growing faster than assets, the company may be increasing efficiency, generating more revenue per dollar invested in assets.
Moreover, if net income grows faster than revenue, it indicates increasing profitability. However, the analyst must determine whether this net income growth stems from ongoing operations or non-recurring items.
Additionally, a decline in operating cash flow despite rising revenue and net income warrants further investigation as it may signal issues with earnings quality, potentially due to aggressive revenue reporting. Conversely, if assets grow faster than revenue, it may suggest declining efficiency, necessitating an examination of the asset composition and the reasons for these changes.
Graphs are an effective tool for comparing performance and financial structure over time, highlighting key changes in business operations. They offer analysts and management a visual summary of risk trends within the company. Additionally, graphs can effectively convey an analyst’s conclusions about financial health and risk management.
Selecting the right type of graph to present the key findings of a financial analysis requires skill. Generally, pie charts are ideal for showing the composition of a total value, such as assets, over a short period (one or two periods). Line graphs are suitable for illustrating changes in amounts for a few items over a longer period. When both composition and amounts, along with their changes over time, are important, a stacked column graph can be particularly useful.
Example: Graph Analysis
Consider the following stacked column graph of the vertical common-size (partial) balance sheet of the hypothetical company Prudential World Assets:
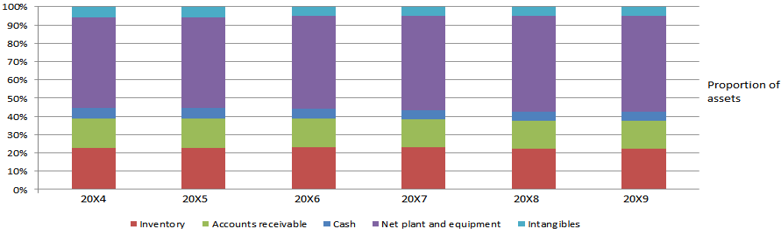
Analyze the asset composition of the company.
Solution
Overall, the graph shows that the asset composition of Prudential World Assets has been quite stable over the years, with slight increases in inventory and intangibles and a noticeable decrease in cash. The consistency in net plant and equipment and accounts receivable suggests stable operational management. The decreasing cash reserves warrant further investigation to understand the company’s cash utilization strategy
When examining the trend in a specific line item or ratio, visually assessing the changes is often possible. However, for more intricate scenarios, regression analysis can be employed to identify relationships or correlations between variables.
For instance, regression analysis might link a company’s sales to GDP over time, offering insights into the company’s cyclical nature. Furthermore, the statistical relationship between sales and GDP can serve as a foundation for sales forecasts. Regression analysis can also be useful in other contexts, such as examining the relationship between a company’s sales and inventory over time or between hotel occupancy and a company’s hotel revenues.
Beyond forecasting, regression analysis helps in identifying items or ratios that deviate from expected patterns based on historical statistical relationships.
Effective analysis integrates both computations and interpretations. Unlike a simple aggregation of data, computations, tables, and graphs, a well-reasoned analysis synthesizes the collected data into a unified understanding. When analyzing past performance, the analysis should not only address what happened but also why it happened and whether it created value. Key questions to consider include:
For forward-looking analysis, additional questions include:
Analysts often need to communicate their findings in a written report. This report should clearly explain how conclusions were reached and the reasons behind specific recommendations. Key elements of an effective report include:
Using 3-10 years of data and appropriate analytic techniques enhances the narrative. The report should be continuous and cohesive, integrating all these elements to present a clear and comprehensive picture of the findings and their implications.
Question 1
Which of the following is least likely a typical approach to comparing financial data reported in different currencies?
- Comparing financial data using ratios.
- Using trailing twelve months of data for each company being compared.
- Translating all reported currencies into one common currency using the prevailing foreign exchange rates at the relevant period’s end.
Solution
The correct answer is B.
Using trailing twelve months of data is useful when differences exist in the fiscal year ends of the companies being compared. It is not used for comparing companies whose differences lie in the reporting currency used to prepare their financial statements.
Options A and C describe typical approaches to overcome differences in reported currencies.
Question 2
To compare the performance of two companies with different end-of-period dates, an analyst would most likely use:
- Ratio analysis.
- Regression analysis.
- Trailing twelve months analysis.
Solution
The correct answer is C.
It is better to start the comparison by compounding the financial results of each company. The rationale for doing so is to match the data collected on each company with the data collected on the other company (in terms of time of occurrence). In other words, an analyst must first compound the financial data of the trailing twelve months of each company to make sure that he is comparing apples to apples.
Solve FRM-style questions on principal components and multi-factor risk models.


Get Ahead on Your Study Prep This Cyber Monday! Save 35% on all CFA® and FRM® Unlimited Packages. Use code CYBERMONDAY at checkout. Offer ends Dec 1st.