Describe Qualities of Effective Centra ...
[vsw id=”KKHi1HKTpD4″ source=”youtube” width=”611″ height=”344″ autoplay=”no”] The central bank of any nation worldwide... Read More
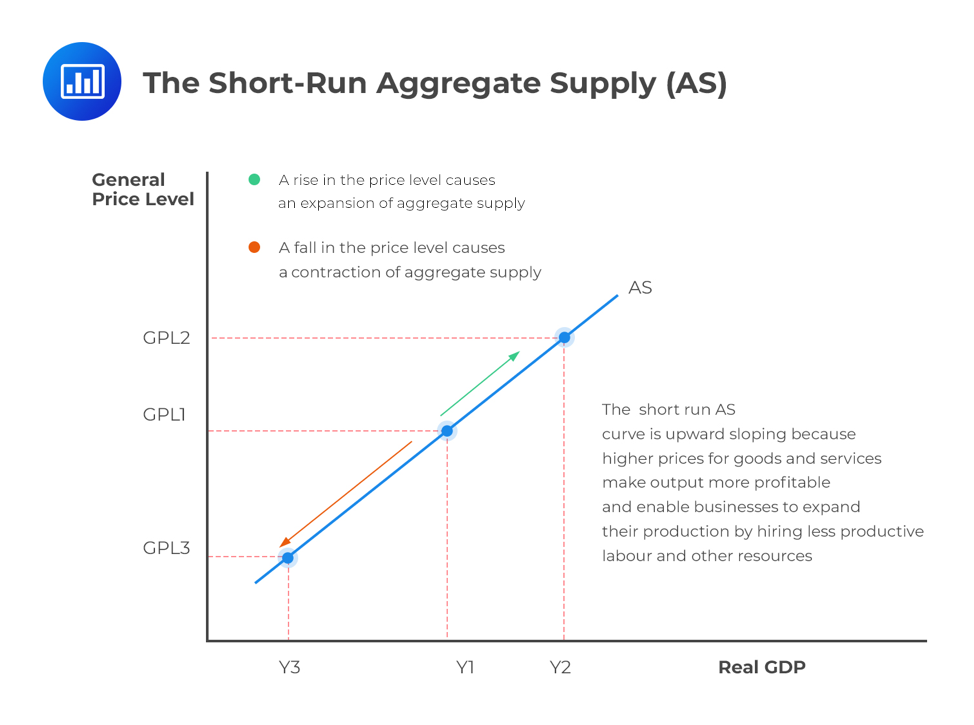
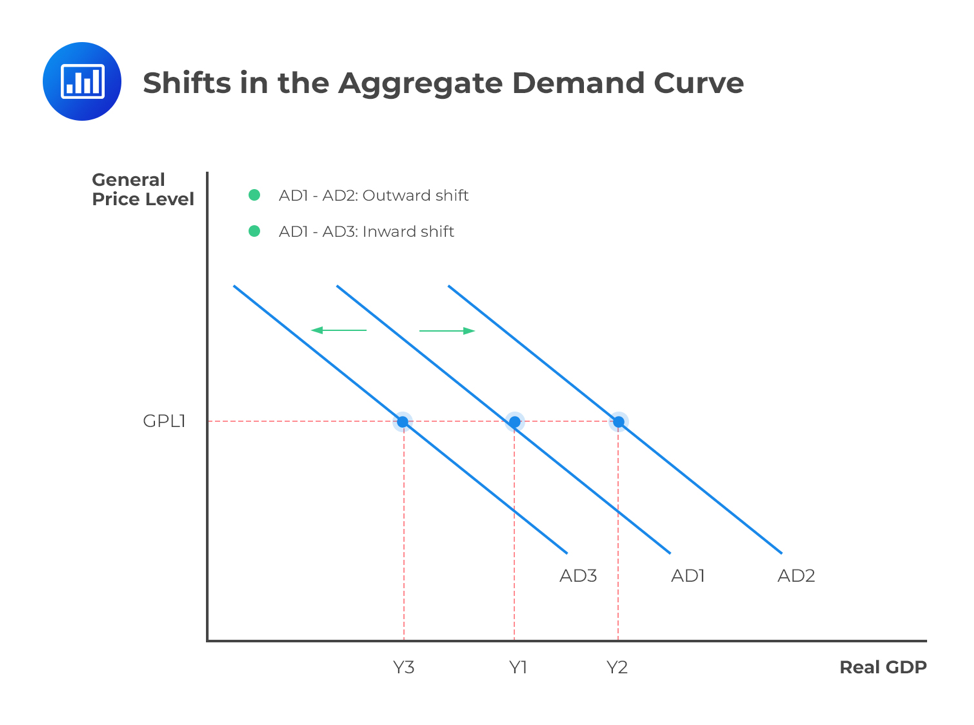
Aggregate demand (AD) and aggregate supply (AS) curves address economic issues such as expansions and contractions of the economy, causes of inflation, and changes in unemployment levels. Movements along these curves are caused by price level variations, while shifts of these curves happen when another variable (other than the price level) affects the demand for goods and services.
Price is the main cause of movements along the aggregate demand curve. When the price level rises, the real money supply declines, forcing the interest rates to rise. Due to high interest rates, investments and savings reduce, thus lowering income levels for a short period of time. When price levels decrease, the real money supply increases. This reduces the interest rate, thereby encouraging investments and savings. Subsequently, this increases income levels.
Price is the main contributor to the movement along the supply curve. In the short run, as price levels increase, businesses report higher profits. This increases their total production level. When price levels fall, they suffer losses, thereby reducing production.

Price and other factors influencing the level of expenditure by households, governments, firms, and foreigners will cause a shift in the aggregate demand curve.

Those factors include:
Household wealth incorporates both financial and real assets. Households save part of their income to accumulate wealth. With assets increasing in value, they will be forced to save less and increase spending, thus shift the aggregate demand curve to the right. Conversely, a decrease in wealth reduces consumer spending and shifts the aggregate demand curve to the left. Economists commonly call this the wealth effect.
When consumers have higher confidence in staying out of unemployment, they tend to consume more, thus shifting the aggregate demand curve to the right. However, when consumers lack confidence, spending declines, shifting the AD curve to the left. For example, in the US, AIM’s Business Confidence Index is a widely followed economic indicator used by employers, traders, and governments to gauge the sentiments of consumers.
Capacity utilization is a measure of how the economy’s production capacity is fully utilized. Businesses running below full capacity are often willing to increase their investment spending during economically good times. This makes the aggregate demand curve shift rightwards.
Fiscal policy refers to the use of taxes and government spending to affect the level of aggregate expenditure. The rise in government expenditure shifts the aggregate demand curve rightwards, while a reduction in government expenditure shifts the curve to the left. This can be seen in almost every country, but most notably in the US, where infrastructure spending has been a top priority for governments in the last decade. The bet that the governments are making is that keeping people employed will have them spend more and subsequently stimulate the economy.
Low taxes lead to an increment of the proportion of personal income and corporate pre-tax profits. Thanks to this, individual consumers and the business entities have more to spend, shifting the AD curve to the right. On the other hand, high taxes will shift AD to the left.
Monetary policy refers to the method a country’s central bank uses to alter aggregate output and prices by changing bank reserves and reserve requirements. Central banks, through various monetary policies, control money supply. An increase in money supply causes a rightward shift in the aggregate demand curve. A reduction in money supply, on the other hand, shifts the aggregate demand curve leftwards.
Through international trade, countries connect to form a global economy. A rapid economic growth in a foreign country encourages such a country to buy more products from other countries. This increases the exports of the countries from which it buys. As a result of such transactions, the AD of the countries that export their products to the foreign country will shift to the right. This will also imply that a decline in the growth rate in the exporting countries will affect the AD of the importing country.
An exchange rate refers to the value of one currency in relation to another. Changes in exchange rates affect the prices of exports and imports, which, in turn, affect the AD. For example, a lower Canadian Dollar in relation to other currencies makes Canadian exports cheaper and foreign products sold in Canada expensive, shifting the AD curve of Canada to the right and vice versa.
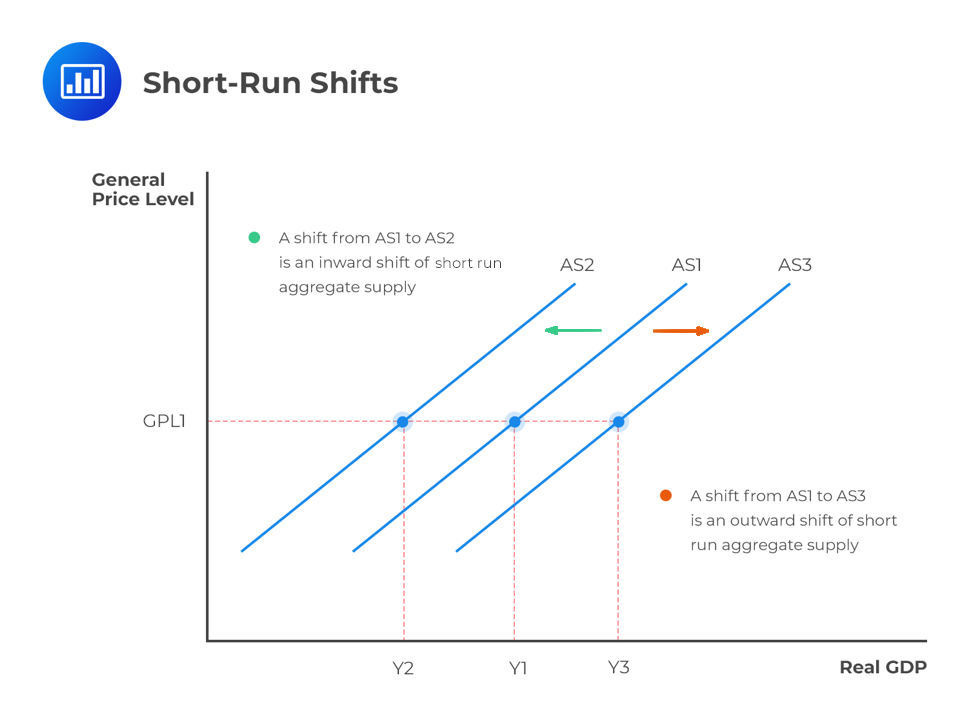
Factors that influence the cost of production will cause a shift in the aggregate supply curve in the short and long run.

The factors that cause aggregate supply curve short-run shifts include:
An increase in nominal wages increases production costs, hence a leftward shift in the aggregate supply curve. A decrease in nominal wages results in a shift of the aggregate supply curve to the right.
Higher input prices increase production cost and cause output reduction. This results in a leftward shift in the aggregate supply curve. On the other hand, lower input prices reduce the cost of production and consequently bring about a rightward shift.
Increased taxes result in high production costs that shift the curve to the left. Reduced taxes and subsidies reduce production costs, causing a shift of the curve to the right.

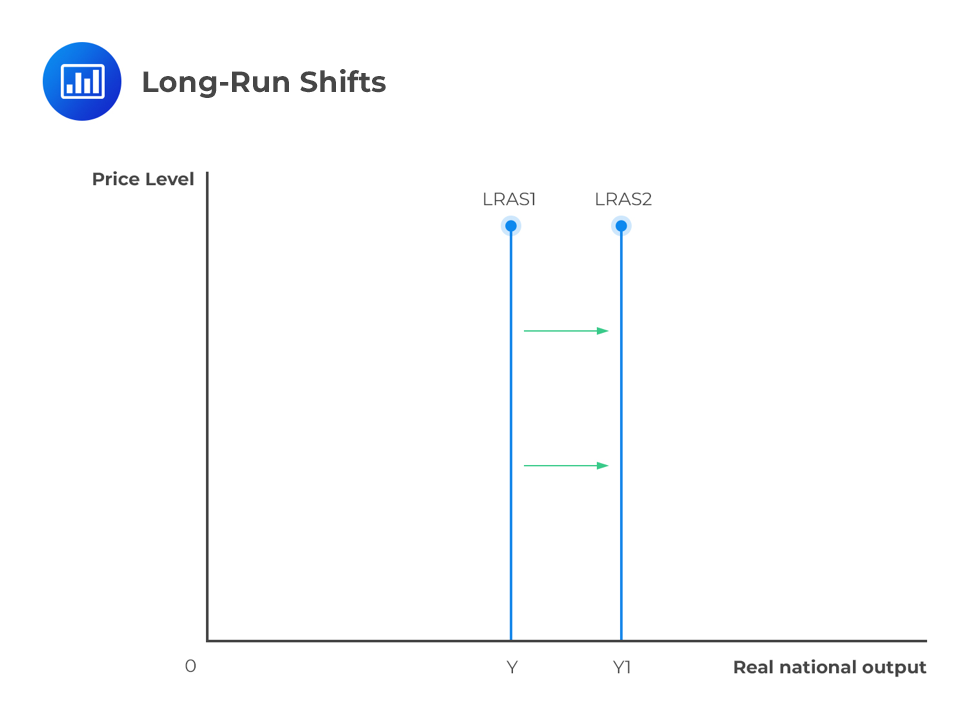
The factors that cause aggregate supply curve long-run shifts include:
With high productivity and developed technology, the cost of production shifts the aggregate supply curve both in a long and short-run right. Conversely, poor technology shifts the curve to the left.
When the supply of labor in a country is large, the country can produce more goods and services. This shifts the LRAS to the right. Conversely, a decrease in labor supply shifts the curve to the left.
Natural resources include oil, water, etc. The ready availability of natural resources will shift the LRAS to the right.
An increase in physical capital will increase the capacity of the economy to produce goods and services. For instance, improving working conditions for workers will increase the output and shift the LRAS to the right.
This involves improving the quality of the labor force through training, skill development, and education. This will, in turn, shift the LRAS to the right.
Question
Which of the following causes shifts of the aggregate demand (AD) curve?
A. A change in the price level
B. A change in household wealth
C. Both A and B
Solution
The correct answer is B.
Shifts of the AD curve happen when another variable (other than the price level) affects the demand for goods and services. Households save part of their income to accumulate wealth. With assets increasing in value, households will be forced to save less and increase spending, thus shift the aggregate demand curve to the right.
Option A is incorrect. Movements along the aggregate demand curve are caused by price level variations. As such, Option C is also incorrect.
Get Ahead on Your Study Prep This Cyber Monday! Save 35% on all CFA® and FRM® Unlimited Packages. Use code CYBERMONDAY at checkout. Offer ends Dec 1st.