Quantiles and Related Visualizations

Quantiles and Related Visualizations

Quantiles

Quartiles, quintiles, deciles, and percentiles are values or cut points that partition a finite number of observations into nearly equal-sized subsets. The number of partitions depends on the type of cut point involved.

Quartiles

They divide data into four parts. The first quartile, Q1, is referred to as the lower quartile, and the last quartile, Q4, is known as the upper quartile. Q1 splits data into the lower 25% of the values and the upper 75%. Similarly, the upper quartile subdivides data into the lower 75% of the values and the upper 25%. The difference between the upper and lower quartile is known as the interquartile range, which indicates the spread of the middle 50% of the data under review.

Quintiles

Though rarely used in practice, quintiles split a set of data into five equal parts, i.e., fifths. Therefore, the second quintile splits data into the lower 40% of the values and the upper 60%.

Deciles

The deciles subdivide data into ten equal parts. There are 10 deciles in any data set. For example, the fourth decile splits data into the lower 40% of the values and the upper 60%.

Percentiles

Percentiles split data into 100 equal parts, i.e., hundredths. So, for instance, the 77th percentile splits the data into the lower 77% of the values and the upper 23%.

Financial analysts commonly use the four types of subdivisions to rank investment performance. You should note that quartiles, quintiles, and deciles can all be expressed as percentiles. For instance, the first quartile is just the 25th percentile. Similarly, the fourth decile is simply the 40th percentile. This enables the application of the formula below:

$$ \text{Position of percentile} =\cfrac {(n + 1) y}{100} $$

Where \(n\) is the number of observations and \(y\) is the percentile.

Note: You must always order the data set, usually in ascending order, before calculating any of these values.

Example: Quartiles

Given the following distribution of returns, calculate the lower quartile.

{10%   23%   12%   21%   14%   17%   16%   11%   15%   19%}

Solution

First, we have to arrange the values in ascending order:

{10%   11%   12%   14%   15%   16%   17%   19%    21%   23%}

Next, we establish the position of the first quartile. This is simply the 25th percentile. Therefore:

$$ \begin{align*} P_{25} & =\cfrac {(10 + 1)25}{100} \\ & = 2.75^{\text{th}} \text{ value}\\ \end{align*} $$

Since the value is not straightforward, we have to extrapolate between the 2nd and the 3rd data points. The 25th percentile is three-fourths (0.75) of the way from the 2nd data point (11%) to the 3rd data point (12%):

$$ \begin{align*} & 11\% + 0.75 * (12 – 11) \\ & = 11.75\% \end{align*} $$

Box and Whisker Plot

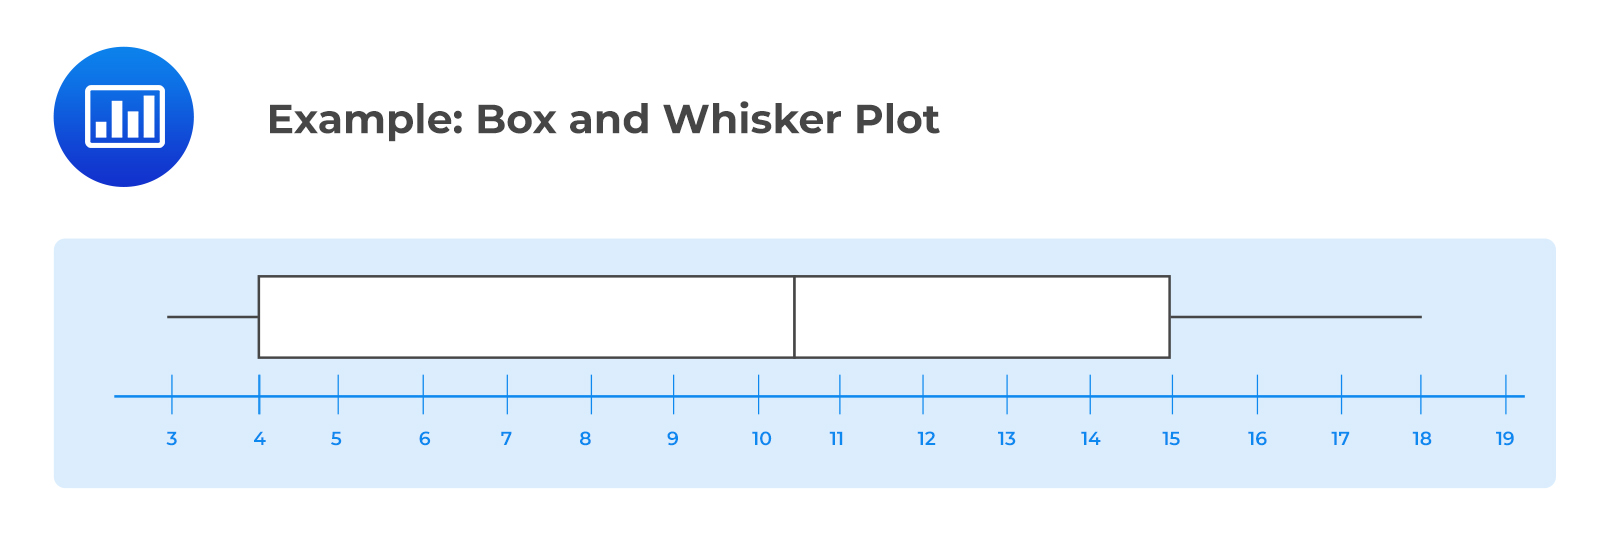
Box and whisker plot is used to display the dispersion of data across quartiles. A box and whisker plot consists of a “box” with “whiskers” connected to the box. It shows the following five-number summary of a set of data.

Example: Box and Whisker Plot

Consider the following box and whisker plot:

Example: Box and Whisker Plot

  1. Which of the following is most likely the median?
    1. 10.
    2. 10.5.
    3. 11.
  1. Which of the following is most likely the interquartile range?
    1. 4.5.
    2. 6.5.
    3. 11.
  1. Which of the following is most likely the 3rd Quartile?
    1. 4.
    2. 15.
    3. 18.

Solutions

  1. B is correct. Median or Quartile 2 (Q2) = \(\frac{(10+11)}{2} = 10.5\)
  2. C is correct. Interquartile Range is \(Q_3 − Q_1 = 15 − 4 = 11\)
  3. B is correct. Quartile 3 (Q3) is \(\frac{3\times (n + 1)}{ 4} = \frac{3(7+1)}{ 4 }\)= 6th term which is 15.

Quantiles in Investment Practice

  • Quantiles are used to rank performance.
  • Quantiles can be used in investment research for comparison purposes. For example, companies can be clustered into deciles to compare the performance of small companies with the large ones. In this case, the first decile will contain the portfolio of companies with the smallest market values, while the tenth decile will contain the companies with the largest market values.

Question

A mutual fund achieved the following rates of growth over an 11-month period:

{3%   2%   7%   8%   2%   4%   3%   7.5%   7.2%   2.7%   2.09%}

The 5th decile from the data is closest to:

  1. 2%.
  2. 3%.
  3. 4%.

Solution

The correct answer is B.

First, you should re-arrange the data in ascending order:

{2%   2%  2.09%  2.7%    3%   3%   4%   7%   7.2%   7.5%   8%}

Secondly, you should establish the 5th decile. This is simply the 50th percentile and is actually the median:

$$ \begin{align*} P_{50} & =\frac {(1 + 11) 50}{100} \\ & = 12 \times 0.5 \\ & = 6 \text{ i}.\text{e}. \text{ the }6^{\text{th}} \text{ data point}. \\ \end{align*} $$

Therefore,

$$ \text{the } 5^{\text{th}} \text{ decile} = 50^{\text{th}} \text { percentile} = \text{median} = 3\% $$

Shop CFA® Exam Prep

Offered by AnalystPrep

Featured Shop FRM® Exam Prep Learn with Us

    Subscribe to our newsletter and keep up with the latest and greatest tips for success
    Shop Actuarial Exams Prep Shop Graduate Admission Exam Prep


    Sergio Torrico
    Sergio Torrico
    2021-07-23
    Excelente para el FRM 2 Escribo esta revisión en español para los hispanohablantes, soy de Bolivia, y utilicé AnalystPrep para dudas y consultas sobre mi preparación para el FRM nivel 2 (lo tomé una sola vez y aprobé muy bien), siempre tuve un soporte claro, directo y rápido, el material sale rápido cuando hay cambios en el temario de GARP, y los ejercicios y exámenes son muy útiles para practicar.
    diana
    diana
    2021-07-17
    So helpful. I have been using the videos to prepare for the CFA Level II exam. The videos signpost the reading contents, explain the concepts and provide additional context for specific concepts. The fun light-hearted analogies are also a welcome break to some very dry content. I usually watch the videos before going into more in-depth reading and they are a good way to avoid being overwhelmed by the sheer volume of content when you look at the readings.
    Kriti Dhawan
    Kriti Dhawan
    2021-07-16
    A great curriculum provider. James sir explains the concept so well that rather than memorising it, you tend to intuitively understand and absorb them. Thank you ! Grateful I saw this at the right time for my CFA prep.
    nikhil kumar
    nikhil kumar
    2021-06-28
    Very well explained and gives a great insight about topics in a very short time. Glad to have found Professor Forjan's lectures.
    Marwan
    Marwan
    2021-06-22
    Great support throughout the course by the team, did not feel neglected
    Benjamin anonymous
    Benjamin anonymous
    2021-05-10
    I loved using AnalystPrep for FRM. QBank is huge, videos are great. Would recommend to a friend
    Daniel Glyn
    Daniel Glyn
    2021-03-24
    I have finished my FRM1 thanks to AnalystPrep. And now using AnalystPrep for my FRM2 preparation. Professor Forjan is brilliant. He gives such good explanations and analogies. And more than anything makes learning fun. A big thank you to Analystprep and Professor Forjan. 5 stars all the way!
    michael walshe
    michael walshe
    2021-03-18
    Professor James' videos are excellent for understanding the underlying theories behind financial engineering / financial analysis. The AnalystPrep videos were better than any of the others that I searched through on YouTube for providing a clear explanation of some concepts, such as Portfolio theory, CAPM, and Arbitrage Pricing theory. Watching these cleared up many of the unclarities I had in my head. Highly recommended.