


Probability Trees
A tree diagram is a visual representation of all possible future outcomes and... Read More

Analysts are often interested in establishing whether there exists a significant difference between the means of two different populations. For instance, they might want to know whether the average returns for two subsidiaries of a given company exhibit a significant variance. Such a test may then be used to make decisions regarding resource allocation or the rewarding of the directors. Before embarking on such an exercise, it is paramount to ensure that the samples taken are not only independent but also sourced from normally distributed populations. It can either be assumed that the population variances are equal or unequal. In this reading, we will assume that the population variances are equal.
Assume that \(\mu_1\) is the mean of the first population while \(\mu_2\) is the mean of the second population. In testing the equality of two population means, we wish to determine if they are equal or not. As such, the hypotheses can be any of the following:
I. Two-sided
$$H_0: µ_1 – µ_2 = 0\ \text{vs.}\ H_a∶ µ_1 – µ_2 ≠ 0,$$
This can be stated as:
$$H_0: µ_1 = µ_2\ \text{vs.}\ H_a ∶ µ_1 ≠ µ_2$$
II. One-sided (right)
$$H_0: µ_1 – µ_2 \leq 0\ \text{vs.}\ H_a∶ µ_1 – µ_2 > 0,$$
This can be stated as:
$$H_0: µ_1 \leq µ_2\ \text{vs.}\ H_a ∶ µ_1 > µ_2$$
III. One-sided (Left)
$$H_0: µ_1 – µ_2 \geq 0\ \text{vs.}\ H_a∶ µ_1 – µ_2 < 0,$$
This can be stated as:
$$H_0: µ_1 \geq µ_2\ \text{vs.}\ H_a ∶ µ_1 < µ_2$$
However, note that tests such as \(H_0: µ_1 – µ_2 =3\ vs. H_a∶ µ_1 – µ_2 ≠ 3\). The process is similar in both cases.
When testing for the difference between two population means, we assume that the two populations are distributed normally. Further, we assume that they have equal and unknown variances. We always make use of the student’s t-distribution where the test statistic is given by:
$$
t=\frac{\left(\bar{X}_{1}-\bar{X}_{2}\right)-\left(\mu_{1}-\mu_{2}\right)}{\sqrt{\frac{s_{p}^{2}}{n_{1}}+\frac{s_{p}^{2}}{n_{2}}}}=\frac{\left(\bar{X}_{1}-\bar{X}_{2}\right)-\left(\mu_{1}-\mu_{2}\right)}{s_p\left(\sqrt{\frac{1}{n_{1}}+\frac{1}{n_{2}}}\right)}
$$
Where \(s_p^2\) is pooled estimator of the common variance and is given by:
$$
s_{p}^{2}=\frac{\left(n_{1}-1\right) s_{1}^{2}+\left(n_{2}-1\right) s_{2}^{2}}{n_{1}+n_{2}-2}
$$
Also, the variables are defined as follows:
\(\bar{X}_1\) = Mean of the first sample.
\(\bar{X}_2\) = Mean of the second sample.
\(s_1^2\) = Variance of the first sample.
\(s_2^2\) = Variance of the second sample.
\(n_1\) = Sample size of the first sample.
\(n_2\) = Sample size of the second sample.
Nutritionists want to establish whether obese patients on a new special diet have a lower weight than the control group. After six weeks, the average weight of 10 patients (group A) on the special diet is 75kg, while that of 10 more patients of the control group (B) is 72kg. Carry out a 5% test to determine if the patients on the special diet have a lower weight.
Additional information: \(\sum A^2 = 59520\) and \(\sum B^2 =56430 \).
Solution
As is the norm, start by stating the hypothesis:
$$H_0: µ_1 – µ_2 = 0\ \text{Vs}\ H_a∶ µ_1 – µ_2 ≠ 0,$$
We assume that the two samples have equal variances, are independent, and distributed normally. Then, under H0,
$$ \frac { \bar { B } -\bar { A } }{ S\sqrt { \frac { 1 }{ m } +\frac { 1 }{ n } } } \sim { t }_{ m+n-2 } $$
Note that the sample variance is given by:
$$s^2=\frac{\sum X^2 -n\bar{X}^2}{n-1}$$
So,
$$ \begin{align*} { S }_{ A }^{ 2 } & =\frac { \left\{ 59520-{ \left( 10\ast { 75 }^{ 2 } \right) } \right\} }{ 9 } =363.33 \\ { S }_{ B }^{ 2 } & =\frac { \left\{ 56430-{ \left( 10\ast { 72}^{ 2 } \right) } \right\} }{ 9 } =510 \\ \end{align*} $$
$$
Therefore,
$$ S^p_2 =\cfrac {(9 × 363.33 + 9 × 510)}{(10 + 10 -2)} = 436.665 $$
And
$$ \text{Test statistic} =\cfrac {(75 -72)}{ \left\{ \sqrt{439.665} × \sqrt{ \left(\frac {1}{10} + \frac {1}{10}\right)} \right\} }= 0.3210 $$
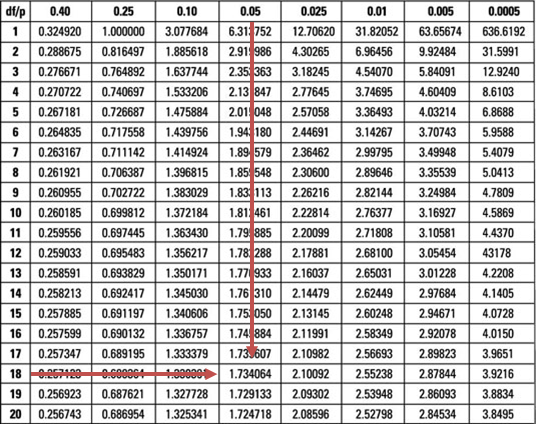
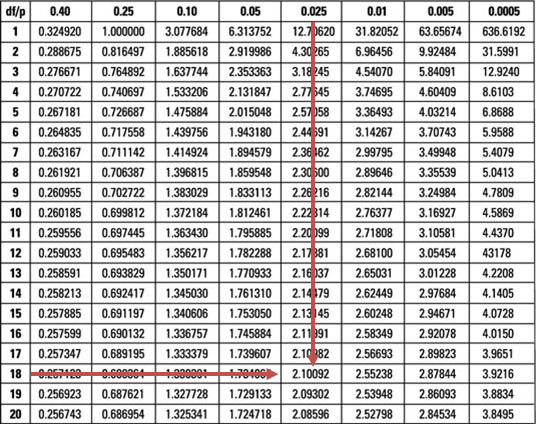
Our test statistic (0.3210) is less than the upper 5% point (1.734) of the t-distribution with 18 degrees of freedom.
Therefore, we do not have sufficient evidence to reject the H0 at 5% significance. As such, it is reasonable to conclude that the special diet has the same effect on body weight as the placebo.
Note to candidates: You could choose to work with the p-value and determine P(t18 > 0.937) and then establish whether this probability is less than 0.05. Working out the problem this way would lead to the same conclusion as above.
Suppose we replace ‘>’ with ‘≠’ in H1 in the example above, would the decision rule change?
Replacing ‘>’ with ‘≠’ in H1 would change the test from a one-tailed one to a two-tailed test. We would compute the test statistic just as demonstrated above. However, we would have to divide the level of significance by two and compare the test statistic to both the lower and upper 2.5% points of the t18-distribution (±2.101).
Since our test statistic lies within these limits (non-rejection region), the decision rule would, therefore, remain unchanged.


