t-Distribution and Degrees of Freedom

t-Distribution and Degrees of Freedom

A student’s t-distribution is a bell-shaped probability distribution symmetrical about its mean. It is regarded as the most suitable distribution to use in the construction of confidence intervals in the following instances:

  1. When dealing with small samples of less than 30 elements.
  2. When the population variance is unknown.
  3. When the distribution involved is either normal or approximately normal.

Apart from being used in the construction of confidence intervals, a t-distribution is used to test the following:

  • Single population mean.
  • The differences between two population means.
  • The mean difference between paired (dependent) populations.
  • The population correlation coefficient.

In the absence of explicit normality of a given distribution, a t-distribution may still be appropriate for use if the sample size is large enough for the central limit theorem to be applied. In such a case, the distribution is considered approximately normal.

A t-statistic, also called the t-score, is given by:

$$ t = \cfrac {(x – \mu)}{\left(\cfrac {S}{\sqrt n} \right)} $$

Where:

\(x\) = Sample mean.

\(μ\) = Population mean.

\(S\) = Sample standard deviation.

\(n\) = Sample size.

Relationship between the t-distribution and the Normal Distribution

A t-distribution allows us to analyze distributions that are not perfectly normal. A t-distribution has thicker tails relative to a normal distribution.

t-distribution-vs-normal-distribution

The shape of a t-distribution is dependent on the number of degrees of freedom. It, therefore, follows that as the number of d.f. increases, the distribution becomes more ‘spiked,’ and its tails become thinner, closer to those of the normal distribution.

The t-distribution has the following properties:

  • A t-distribution is symmetrical. It is a bell-shaped distribution that assumes the shape of a normal distribution and has a mean of zero.
  • A t-distribution is defined by one parameter, that is, degrees of freedom (df) \(v= n – 1\), where \(n\) is the sample size. Its \(\text {variance} = \frac {v}{ \left(\frac {v}{2} \right) }\), where \(v\) represents the number of degrees of freedom and \(v ≥ 2\).
  • The variance is greater than 1 at all times. Note, however, that it gets very close to one when there are many degrees of freedom. With a large number of degrees of freedom, a t-distribution resembles a normal distribution.
  • The tails of a t-distribution are fatter and less peaked than those of a normal distribution, indicating more probability in the tails.
  • The shape of a t-distribution changes with the change in the degrees of freedom. The more the d.f. increase, the more the shape of a t-distribution looks like a standard normal distribution.

The Degrees of Freedom

A t-distribution, just like several other distributions, has only one parameter: The degrees of freedom (d.f.). The number of degrees of freedom refers to the number of independent observations (total number of observations less 1):

$$ v = n-1 $$

Hence, a sample of 10 observations or elements would be analyzed using a t-distribution with 9 degrees of freedom. Similarly, a 6 d.f. distribution would be used for a sample size of 7 observations.

Notations

It is the standard practice for statisticians to use \(t_α\) to represent the t-score with a cumulative probability of \((1 – α)\). Therefore, if we were interested in a t-score with a 0.9 cumulative probability, α would be equal to 1 – 0.9 = 0.1. We would denote the statistic as \(t_0.1\).

However, the value of \(t_α\) depends on the number of degrees of freedom and is often written as \(t_{α,n-1}\). For example, we could write \(t_{0.05,2}= 2.92\) where the second subscript (2) represents the number of d.f.

Important Relationships

Just like the normal distribution, the t-distribution is symmetrical about the mean. As such,

$$ t_{\alpha}= -t_{1 – \alpha} \text{ and } t_{1 – \alpha} = -t_{\alpha} $$

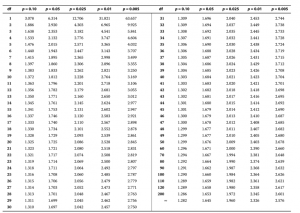
The table below represents one-tailed confidence intervals and various probabilities for a range of degrees of freedom.

Question

Which of the following statements regarding a t-distribution is most likely correct?

  1. A t distribution is less spread out than a standard normal distribution.
  2. A t-distribution is symmetric about zero.
  3. As the degrees-of-freedom increase, a t-distribution becomes wider and flat.

Solution

The correct answer is B.

A t-distribution is a symmetrical, bell-shaped distribution that looks like a normal distribution and has a mean of zero.

A is incorrect. A t-distribution is more spread out than a standard normal distribution.

C is incorrect. As the degrees-of-freedom increase, a t-distribution becomes narrower, taller, and approaches a standard normal distribution.

Shop CFA® Exam Prep

Offered by AnalystPrep

Featured Shop FRM® Exam Prep Learn with Us

    Subscribe to our newsletter and keep up with the latest and greatest tips for success
    Shop Actuarial Exams Prep Shop Graduate Admission Exam Prep


    Sergio Torrico
    Sergio Torrico
    2021-07-23
    Excelente para el FRM 2 Escribo esta revisión en español para los hispanohablantes, soy de Bolivia, y utilicé AnalystPrep para dudas y consultas sobre mi preparación para el FRM nivel 2 (lo tomé una sola vez y aprobé muy bien), siempre tuve un soporte claro, directo y rápido, el material sale rápido cuando hay cambios en el temario de GARP, y los ejercicios y exámenes son muy útiles para practicar.
    diana
    diana
    2021-07-17
    So helpful. I have been using the videos to prepare for the CFA Level II exam. The videos signpost the reading contents, explain the concepts and provide additional context for specific concepts. The fun light-hearted analogies are also a welcome break to some very dry content. I usually watch the videos before going into more in-depth reading and they are a good way to avoid being overwhelmed by the sheer volume of content when you look at the readings.
    Kriti Dhawan
    Kriti Dhawan
    2021-07-16
    A great curriculum provider. James sir explains the concept so well that rather than memorising it, you tend to intuitively understand and absorb them. Thank you ! Grateful I saw this at the right time for my CFA prep.
    nikhil kumar
    nikhil kumar
    2021-06-28
    Very well explained and gives a great insight about topics in a very short time. Glad to have found Professor Forjan's lectures.
    Marwan
    Marwan
    2021-06-22
    Great support throughout the course by the team, did not feel neglected
    Benjamin anonymous
    Benjamin anonymous
    2021-05-10
    I loved using AnalystPrep for FRM. QBank is huge, videos are great. Would recommend to a friend
    Daniel Glyn
    Daniel Glyn
    2021-03-24
    I have finished my FRM1 thanks to AnalystPrep. And now using AnalystPrep for my FRM2 preparation. Professor Forjan is brilliant. He gives such good explanations and analogies. And more than anything makes learning fun. A big thank you to Analystprep and Professor Forjan. 5 stars all the way!
    michael walshe
    michael walshe
    2021-03-18
    Professor James' videos are excellent for understanding the underlying theories behind financial engineering / financial analysis. The AnalystPrep videos were better than any of the others that I searched through on YouTube for providing a clear explanation of some concepts, such as Portfolio theory, CAPM, and Arbitrage Pricing theory. Watching these cleared up many of the unclarities I had in my head. Highly recommended.